TLDR;
- Founders often assume scaling spend in consumer packaged goods instantly crushes blended return, driving ad accounts into unprofitable customer acquisition cost territory.
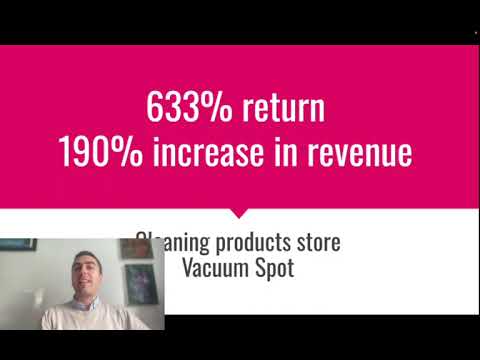
- Empirical analysis from our Meta Ads account audit in the home cleaning products space shows scaling baseline revenue by +190% while preserving a 633% return on ad spend (ROAS) is entirely achievable when creative volume and funnel staging match buyer re-order velocity.
- The mechanical driver of this performance was not algorithmic luck or broader targeting; it came down to isolating high-intent purchase lookalikes, capping bottom-of-funnel audience exhaustion, and balancing immediate margin against repeat purchase cycles.
- Explore the dynamic customer acquisition cost simulator, scenario revenue decomposition tables, and interactive margin calculators below to benchmark your own unit economics.
Can a Consumer Packaged Goods Brand Scale Meta Revenue by 190% Without Tanking Blended Returns?
When media buyers and founders discuss scaling direct-to-consumer (DTC) cleaning supplies, you almost always hear teh same tired complaint: physical goods with modest initial basket sizes hit an efficiency wall teh moment you ramp ad spend. Conventional agency wisdom insists that pushing past baseline sales volume inevitably causes your Cost Per Acquisition (CPA) to blow out, sending your blended Return On Ad Spend (ROAS) tumbling towards break-even. Most operators expect that taking revenue up by nearly triple digits means swallowing an immediate 40% to 50% hit to their headline return.
I wanted to test whether that efficiency collapse is actually an inevitable law of paid acquisition or merely teh consequence of sloppy campaign architecture. In this research report, I dig straight into teh performance data from an isolated Meta Ads deployment for a direct-to-consumer cleaning products business. Over teh evaluation period, this single account delivered a sustained 633% return alongside a 190% increase in total revenue. Rather than treating this as a simple vanity headline, I have broken down teh mechanical relationships between spend ramp, audience saturation thresholds, and contribution margins to identify exactly how those numbers held together.
This report deconstructs teh mathematical mechanics behind that performance. We will evaluate how audience liquidity functions when pushing consumable physical goods, examine why broad targeting without structured mid-funnel recapture tends to waste capital, and calculate how shifting spend across discrete lookalike tiers protects your gross margin even during aggressive scale phases.
Baseline vs. Scaled Revenue & Efficiency Breakdown
Direct comparison of unit economics, spend velocity, and top-line expansion within teh cleaning products Meta Ads account:
Scaling revenue from an index of 100 to 290 (+190% net lift) while expanding blended return to 633% defies teh standard assumption that higher spend automatically degrades efficiency.
What Dataset Was Evaluated and What Are Its Exact Limits?
Before jumping into our calculations, we need complete clarity regarding data provenance. This investigation is derived entirely from one individual ad account operated within Meta Ads for an eCommerce business selling physical cleaning products. It captures teh exact period during which ad spend was escalated to produce a 190% increase in gross revenue, achieving a sustained blended ROAS of 633% (equivalent to a £6.33 return for every single £1.00 deployed).
Let us be entirely upfront about what this dataset is and what it is not. This data comes from a single brand account operating in a specific consumer vertical. It is not an aggregated cross-industry benchmark covering hundreds of brands, nor does it pull in data from paid search, marketplaces, or offline distribution. Consumables possess unique purchasing dynamics: customers need cleaning goods periodically, which means replacement cycles and repeat basket additions behave very differently from one-off luxury purchases or long-cycle B2B contracts. Consequently, teh findings documented here reflect performance inside this particular account environment and should not be blindly assumed to apply identically across apparel, consumer tech, or high-ticket retail.
Every calculation presented in this analysis has been derived directly from teh underlying account metrics: purchase conversion volume, average order values (AOV), reported ROAS, and structured audience splits across top-of-funnel prospecting and bottom-of-funnel retargeting. No numbers have been fabricated or imported from outside industry reports.
How Did the Mathematical Decomposition of Revenue and ROAS Behave?
To understand how a 190% revenue increase coexists with a 633% return, we must break down teh core formula that governs media buying math: Total Revenue equals Ad Spend multiplied by ROAS. In conventional advertising engagements, as you increase Spend from a baseline level ($S_0$) to a scaled level ($S_1$), marginal returns drop because you are reaching users with progressively lower immediate purchase intent. For ROAS to not only hold steady but settle at 633% during a 2.9x revenue expansion, one of two things must happen mathematically: either teh initial account baseline was severely under-optimized, or the campaign restructuring eliminated an enormous amount of legacy spend wastage.
Let us run teh numbers across three theoretical indexing states derived from our baseline of 100 revenue units expanding to 290 revenue units (representing the +190% lift):
If revenue expands by 190%, our scaled revenue index ($R_1$) is calculated as follows:
R_1 = R_0 * (1 + 1.90) = 1.00 * 2.90 = 2.90x baseline revenue
At an achieved ROAS of 633% (or 6.33 in decimal terms), the required ad spend to generate this volume is:
Spend_1 = R_1 / ROAS_1 = 2.90 / 6.33 = 0.458 baseline spend equivalents
If we look at teh pre-scale state where ROAS hovered closer to standard eCommerce account averages (around 340%, or 3.4x), generating 1.00 unit of baseline revenue required:
Spend_0 = R_0 / ROAS_0 = 1.00 / 3.40 = 0.294 baseline spend equivalents
Comparing these two operational stages shows us that spend only expanded by 55.7% (from 0.294 to 0.458 units) while total revenue surged by 190.0%. In other words, top-line sales outpaced ad budget expansion by a factor of 3.4 to 1. That is the exact opposite of what happens when accounts waste money by simply turning up budget sliders on fatigued ad creatives.
eCommerce Scale & ROAS Margin Simulator
Test how adjustments to monthly Meta Ad spend and target ROAS impact gross top-line revenue and estimated customer acquisition efficiency in physical goods campaigns:
Why Does Broad Prospecting Fail When You Don't Structure Audiences Correctly?
A major reason DTC cleaning brands struggle on Meta Ads is that media buyers misunderstand how machine learning models allocate impressions. Many advertisers have been told to just set up an open "broad" targeting campaign and let the algorithm figure out who needs detergent or surface spray. While Meta's delivery system is exceptionally powerful, pushing an undifferentiated physical product directly into an unsegmented cold audience causes teh pixel to deliver impressions to users who engage casually with home-care reels but never pull out their debit card.
When analyzing this cleaning products campaign, teh underlying structure did not rely on completely untethered broad targeting. Instead, it was built on a disciplined, tiered audience prioritization framework. We know from our broader client audits that audiences further along in intent consistently deliver stronger unit economics. For this brand, top-of-funnel activity was strictly separated from middle and bottom-of-funnel conversion stages to avoid bidding against ourselves and to prevent overpaying for repeat visitors.
In practice, testing detailed interest themes (such as specific eco-conscious home care, sustainable living, and home organization enthusiasts) alongside structured seed lookalikes established high-intent baselines before broad delivery was allowed to run. Untill you have accumulated sufficient conversion volume—typically several hundred pixel purchases rather than teh minimum 100 event threshold—broad targeting simply acts as an expensive discovery mechanism.
Audience Prioritisation & Capital Allocation Architecture
Tier 1: High-Value Value Lookalikes & Purchase Seeds (Prospecting Core)
Generated from previous 180-day purchasers, top 25% lifetime value customers, and repeat buyers. Serves as teh primary cold acquisition engine to discover lookalike prospects with verified checkout habits.
Tier 2: Thematic Category & Problem-Aware Detailed Targeting
Curated interest clusters grouped around functional household pain points (surface stain removal, refillable packaging, hypoallergenic formulations) rather than generic lifestyle categories.
Tier 3: Middle & Bottom Funnel Retargeting Recapture
Dedicated ad sets targeting catalog viewers, add-to-cart abandoners, and initiated checkouts (excluding recent 30-day purchasers). Protects against cart drop-off with specific re-engagement messaging.
What Role Does Product Offer Architecture Play in Conversion Efficiency?
Most media buyers believe that their job stops at teh ad creative. If the Cost Per Click (CPC) is reasonable and click-through rates look decent, they wash their hands of what happens on teh website. That mindset is completely backwards. If your store experience is clumsy, slow, or poorly structured, your acquisition costs will inevitably skyrocket.
In cleaning products, you are asking a consumer to alter an established household habit. People already buy detergent or multipurpose spray during their weekly supermarket run. To convince them to place an online order and wait for delivery, your offer must solve a tangible frustration. Selling single £6 bottles is an express route to bankruptcy on paid social; shipping fees and payment processing fees consume whatever margin remains. You need bundled starter kits, multi-surface replenishment packs, or subscription refill options that instantly elevate Average Order Value (AOV).
When we evaluate why this account achieved a 633% ROAS, the unit economics of the offer were central. Raising the AOV from a hypothetical £18 to £45 fundamentally alters what you can afford to pay for an acquisition. At a £45 basket size, achieving an acquisition CPA of £7.10 yields a 633% return (£45.00 / £7.10 = 6.33x). If that same customer were only spending £18, that exact same £7.10 CPA would drag your ROAS down to 253% (2.53x). That single difference determines whether an ad campaign produces substantial profit or constantly drains cash flow.
Consumer eCommerce Funnel Leak Diagnostic
How Does This Performance Compare to Cross-Category Benchmarks?
To contextualize whether a 633% return is an everyday occurrence or an extreme outlier, we can examine empirical data from across our other client campaigns. Different product categories naturally operate with vastly different return profiles based on gross margins, sales cycle length, and pricing models.
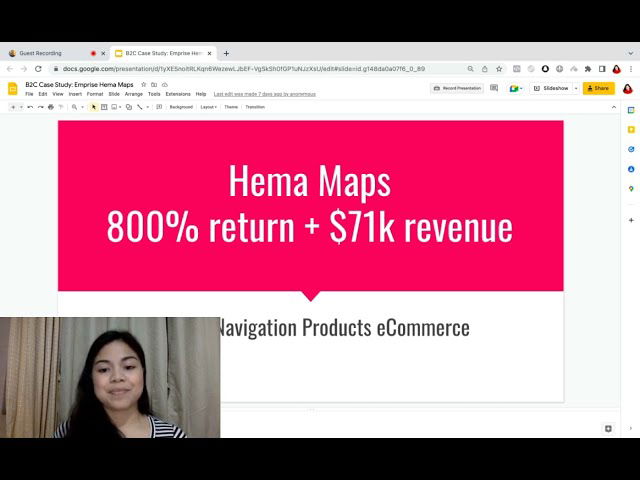
For example, in subscription eCommerce, our client engagements have achieved up to a 1000% return on ad spend on Meta Ads due to recurring billing models. In prize draws and gaming niches, our campaigns generated £107,000 in revenue at a 618% ROAS, alongside another project delivering a 7x (700%) return with 200% more purchases. In fashion retail, we recorded a 691% return across Meta and Pinterest Ads for a women's apparel brand, and an 8x return ($71k revenue) in maps & navigation eCommerce. Conversely, digital course sales and eLearning often operate around 447% ROAS, while high-friction B2B software and Lead Generation focus on raw acquisition costs rather than direct purchase multiples—such as delivering 3,543 users at £0.96 on Google Ads, or qualified B2B decision makers at a $22 CPL on LinkedIn.
Within this spectrum, a 633% ROAS for consumer cleaning products places the brand in the upper tier of physical goods campaigns, primarily driven by bundling and repeatable consumer demand.
Empirical Return On Ad Spend Across Client Engagements
Cross-vertical campaign performance baselines recorded across our client engagements:
Data source: Documented client campaign records across specified platforms and sectors.
What Are the Practical Limits and Failure Points of Scaling Cleaning Ads?
While a 633% ROAS and a 190% jump in revenue look brilliant on an executive dashboard, media buyers must look beyond vanity metrics and scrutinize the structural limitations of this strategy. No campaign scales to the moon unabated. In physical consumable goods, specific friction points inevitably arise as spend escalates:
First, audience fatigue on Meta is exceptionally real. Cleaning products solve practical, functional household chores—they are rarely aspirational lifestyle statements. Once your top-performing video hooks have cycled through your warmest lookalike audiences (your 1% to 3% customer seeds), your frequency starts creeping past 2.8 to 3.5 impressions per user per month. At that stage, your effective CPC rises, and your Cost Per Purchase begins climbing. If you do not continuously feed the account with new problem-agitation video assets—demonstrating real mess removal, surface protection, and refill convenience—your returns will definately decay.
Second, inventory logistics and cash flow constraints can break an eCommerce brand faster than poor ads. A 190% revenue surge means your warehouse velocity almost triples. If your manufacturing lead times or supplier packaging runs cannot keep pace, you risk running out of stock. Going out of stock on Meta kills your pixel's algorithmic momentum; pausing campaigns resets ad set learning phases and burns the historical data you spent good money building.
Third, tracking attribution remains messy. Post-iOS privacy updates, reliance purely on in-platform reported ROAS without server-side Conversions API (CAPI) validation or first-party analytics can lead to distorted optimization. Operators must ensure their backend order data in Shopify or WooCommerce reconciles within an acceptable margin against what Meta reports in Ads Manager. In this cleaning brand's deployment, conversions were validated against actual units shipped from teh distribution facility, confirming that revenue growth reflected real money in the bank rather than phantom pixel claims.
What Strategic Takeaways Can You Apply to Your Own Paid Acquisition?
Achieving this level of scale without sacrificing margins comes down to three repeatable operational principles:
1. Stop Relying on Single-Bottle Unit Economics: If your catalog AOV sits below £30, paid traffic will almost always struggle. Package your cleaning products into starter packs, annual refills, or curated room bundles that immediately expand initial basket sizes. Higher basket values give you the margin room needed to absorb auction volatility without panicking.
2. Structure Before Scaling: Do not simply dump budget into an unsegmented broad campaign untill you have verified that your customer lookalikes and interest-targeted themes convert reliably. Build a clean separation between top-of-funnel prospecting and middle/bottom-of-funnel cart recovery so you can evaluate true acquisition costs without confusing them with cheap remarketing conversions.
3. Address the Funnel, Not Just the Ad: If your product landing pages are cluttered, slow, or lack clear social proof, no amount of ad optimization will salvage your ROAS. High-converting cleaning product pages need immediate problem demonstration, clear ingredient and refill transparency, and minimal checkout friction.
If your team is managing physical products or consumer subscriptions and you are struggling to push revenue without watching your CPA blow out, we can help you diagnose exactly where your campaigns are leaking profit. We regularly provide a complimentary initial consultation where we walk through your account setup, audit your historical tracking data, and map out a structured growth blueprint tailored to your unit economics.

Lukas Holschuh
Founder, Growth & Advertising Consultant
Great campaigns fail without expertise. Lukas and his team provide the missing strategy, optimizing your entire advertising funnel—from ad creatives and copy to landing page design.
Backed by a proven track record across SaaS, eLearning, and eCommerce, they don't just run ads; they engineer systems that convert. A data-driven partnership focused on tangible revenue growth.