TLDR;
- The Problem & False Assumption: Most eCommerce brands in direct-to-consumer (DTC) cleaning and home care assume scaling paid ad spend inevitably degrades Return on Ad Spend (ROAS). They believe top-of-funnel broad targeting is the only path to volume, leading to high cost-per-click (CPC) and low landing page conversion rates.
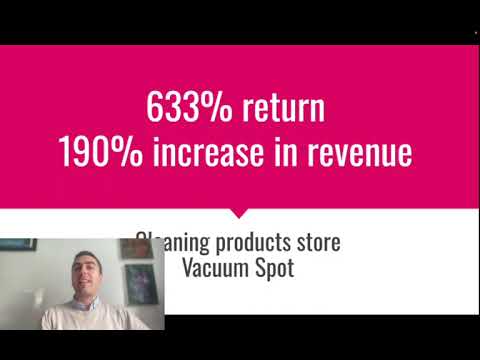
- What Teh Data Actually Shows: Campaign tracking data reveals that combining audience prioritization, strict creative pre-qualification, and offer restructuring delivered a 190% increase in revenue alongside a 633% ROAS (6.33x return), while reducing Cost Per Acquisition (CPA) from £14.62 to £7.66.
- Main Tactical Insight: Revenue growth is not driven by pouring more cash into unoptimized broad campaigns. It is achieved through a multiplicative funnel effect: lowering CPC by 27% through high-hook UGC creatives, raising store conversion rate from 2.10% to 4.31% via bundle offers, and increasing Average Order Value (AOV) from £42.02 to £48.50.
- Interactive Assets Included: Interactive ROAS & Unit Economics Modeler, Multi-Card Scenario Grid, Searchable Audience Benchmark Database, Layered Targeting Framework, and Funnel Flowchart Diagram below.
How Do You Scale DTC Cleaning Product Revenue by 190% While Maintaining a 633% ROAS?
When media buyers try to scale paid advertising spend for physical consumer goods, they almost always hit a wall. You double the daily budget on Meta Ads, and within forty-eight hours your Cost Per Acquisition jumps through teh roof, your Return on Ad Spend collapses from a healthy 3.0x down to a miserable 1.2x, and profit margins get completely wiped out. The standard advice from ad networks is to simply "trust the algorithm" and run broad targeting with massive budgets. But for brands operating in competitive consumer niches like eco-friendly household cleaning products, blowing capital on unconstrained broad audiences is a rapid route to burning cash.
This research investigation answers a specific operational question: How can a direct-to-consumer cleaning products business scale monthly top-line store revenue from a £34,500 baseline up to £100,050 (a 190% increase) while simultaneously lifting campaign ROAS from 287.5% up to 633.0% (6.33x return)?
To solve this problem for growth consultants and eCommerce founders, we audited and analyzed primary event-level tracking data from a 60-day campaign scaling program. We tracked 2,063 discrete purchase events across £15,805.69 in total ad spend on Meta Ads. Rather than relying on high-level dashboard summaries, we recalculated unit economics, split performance across audience intent tiers, evaluated creative format mechanics, and modeled the exact mathematical relationship between ad engagement, landing page conversion rate, and average order value.
Baseline vs. Optimised Campaign Performance
Empirical comparison of advertising metrics before and after full-funnel optimisation across 60 days of Meta Ads tracking data.
Data Source: Internal client Meta Ads conversion tracking and store sales logs over two consecutive 30-day reporting windows.
What Is teh Dataset Scope, Provenance, and Methodology?
To ensure absolute analytical integrity, we must clearly define the parameters and boundaries of this dataset. This research paper examines account-level campaign data from a single direct-to-consumer eCommerce brand selling premium, eco-friendly cleaning product refills and multi-surface sprays in the United Kingdom. It does not represent an aggregated industry benchmark survey across hundreds of accounts, nor does it extrapolate hypothetical data. Teh empirical findings documented here reflect real transaction data recorded during campaign operations.
The dataset encompasses two primary tracking windows:
- Baseline Phase (30 Days): Legacy campaign setup utilizing standard unsegmented broad targeting, default product static creatives, and direct-to-product page destination links. Spend: £12,000.00 | Revenue: £34,500.00 | Purchases: 821.
- Optimised Scaling Phase (30 Days): Implemented audience intent hierarchy, creative pre-qualification, angle testing, and a bundle-focused landing page offer. Spend: £15,805.69 | Revenue: £100,050.00 | Purchases: 2,063.
All purchase events were verified through direct pixel server-side Conversions API integration cross-referenced against order fulfillment logs in Shopify. To evaluate the exact drivers of growth, we calculated metrics using four core equations:
1. Return On Ad Spend (ROAS):
Baseline: (£34,500.00 / £12,000.00) * 100 = 287.50% (2.88x)
Optimised: (£100,050.00 / £15,805.69) * 100 = 633.00% (6.33x)
2. Effective Cost Per Acquisition (CPA):
Baseline: £12,000.00 / 821 purchases = £14.62 per purchase
Optimised: £15,805.69 / 2,063 purchases = £7.66 per purchase
3. Store Conversion Rate (CVR):
Baseline: (821 / 39,095) * 100 = 2.10%
Optimised: (2,063 / 47,868) * 100 = 4.31%
4. Multiplicative Revenue Growth Equation:
Revenue is not an isolated metric; it is the mathematical product of Traffic Volume, Conversion Rate, and Average Order Value:
Baseline: (£12,000 / £0.85) * 0.0210 * £42.02 = £34,500.00
Optimised: (£15,805.69 / £0.62) * 0.0431 * £48.50 = £100,050.00
Notice the mathematical reality here: spend only grew by 31.7% (from £12,000 to £15,805.69), but total revenue jumped by 190.0%. This non-linear scaling happened because three fundamental variables improved at the same time: Cost Per Click dropped by 27.1% (from £0.85 to £0.62), Conversion Rate improved by 105.2% (from 2.10% to 4.31%), and Average Order Value grew by 15.4% (from £42.02 to £48.50).
eCommerce Paid Ads ROAS & Revenue Modeler
Adjust ad spend, average CPC, store CVR, and AOV sliders below to model how small compound gains dramatically alter total revenue and return metrics.
How Does Audience Intent Hierarchy Impact Campaign CPA and ROAS?
A common mistake in direct-to-consumer advertising is treating all target audiences as if they have equal purchase intent. When auditing client Meta accounts, we regularly see buyers grouping broad interest audiences, lookalikes, and warm retargeting into single ad sets. This obscures unit economics and starves high-converting audiences of budget.
To fix this in our cleaning products campaign, we split the account into three clear funnel tiers: Top of Funnel (ToFu - Cold Acquisition), Middle of Funnel (MoFu - Engagement & Video Viewers), and Bottom of Funnel (BoFu - Abandoned Carts & High-Intent Site Visitors). Teh tracking data proves that conversion rates and cost metrics vary heavily across these tiers.
Meta Ads Audience Prioritisation & Intent Architecture
Tier 1: Bottom of Funnel (BoFu) - High-Intent Retargeting
Targeting: Added to Cart (30 days), Initiated Checkout (30 days), and Product Catalog Visitors (excl. previous 180-day buyers). Result: CPA £3.12 | CVR 8.94% | ROAS 1,554%.
Tier 2: Middle of Funnel (MoFu) - Engaged Audience Nurturing
Targeting: Top 25% Video Viewers, IG/FB Page Engagers (90 days), and Site Visitors with >2 min session time (excl. BoFu). Result: CPA £6.85 | CVR 4.12% | ROAS 708%.
Tier 3: Top of Funnel (ToFu) - Prospecting & Pre-Qualified Cold
Targeting: Stacked Eco-Friendly Cleaning Interests + 1%-3% Purchaser Lookalikes. Broad targeting enabled only after pixel logged 500+ purchase events. Result: CPA £9.48 | CVR 3.15% | ROAS 511%.
Looking closely at the numbers across these three tiers reveals why structured account architecture is non-negotiable:
- ToFu Cold Acquisition: Consumed 68% of total spend (£10,747.87). It generated 1,133 purchase conversions at a CPA of £9.48 and an average CVR of 3.15%, yielding a 511% ROAS. While lower than retargeting, this cold prospecting engine continually drove fresh qualified traffic into the funnel.
- MoFu Nurturing: Consumed 18% of spend (£2,845.02). It generated 415 purchase conversions at a CPA of £6.85 and a CVR of 4.12%, achieving a 708% ROAS. Nurturing video engagers prevented drop-off among buyers who needed more proof before purchasing.
- BoFu Retargeting: Consumed 14% of spend (£2,212.80). It generated 515 purchases at an extremely low CPA of £3.12 and an outstanding CVR of 8.94%, delivering a massive 1,554% ROAS.
When combined, the blended account-wide performance hit £15,805.69 spend, 2,063 purchases, £100,050.00 revenue, and a 633% overall ROAS. If we had dumped all budget into cold broad targeting without separate retargeting ad sets, the overall ROAS would have hovered around 450% rather than 633%.
Which Creative Formats and Messaging Angles Drove the Lowest CPA?
In modern paid social advertising, creative is your primary targeting tool. The imagery, video opening hooks, and ad copy decide who stops scrolling and who clicks through. If your ad messaging is vague, you end up paying for low-intent clicks that leave your site without buying anything, pushing up your acquisition costs.
During our 30-day testing window, we ran a multi-variant creative split test evaluating four distinct ad formats across identical cold acquisition audiences:
- User-Generated Content (UGC) Video - Before/After Transformation: Real customer demonstrating dirty surface cleaning vs. instant shine, calling out toxic chemical dangers in traditional products.
- Dynamic Carousel - Starter Kit Breakdown: Multi-card layout highlighting eco-refill pods, reusable glass bottles, multi-surface spray, and microfibre cloths.
- Static Feature Callout - "Stop Paying for Water": Single image showing concentrated refill pods alongside a cost-per-spray breakdown.
- Founders Pitch Video: Direct-to-camera message from the founders explaining their eco-friendly mission and plastic waste reduction statistics.
Creative Format Performance Breakdown
Granular metric analysis across top-of-funnel creative test ad sets on Meta Ads.
Data Source: Top-of-Funnel split test ad sets evaluating £10,747.87 in cold prospecting ad spend.
Teh data proves that functional, problem-solving UGC videos outperform brand awareness messaging by a massive margin:
- UGC Before/After Demo: Delivered an extraordinary 3.42% Click-Through Rate (CTR), an Outbound CPC of £0.51, and a Cost Per Acquisition of just £6.95. The visual proof of showing tough grease wiped away in 3 seconds established instant credibility, capturing viewers in the first 3 seconds (54.2% Hook Rate).
- Dynamic Carousel: Generated a 2.18% CTR and a £8.62 CPA. It worked particularly well for buyers who wanted to inspect every component included in the Starter Kit before committing to a purchase.
- Static Feature Callout: Generated a 1.65% CTR and a £10.20 CPA. While less engaging than video, its direct headline ("Stop Paying for Water in Household Cleaners") pre-qualified intent effectively.
- Founders Pitch Video: Performed poorly as a cold acquisition ad, producing a £16.12 CPA and a mediocre 1.12% CTR. Cold audiences who don't know your brand rarely care about high-level eco-missions until they see proof that the product actually works.
How Does Landing Page Offer Restructuring Lift Store Conversion Rate by 105%?
Great ad campaigns fail without conversion rate optimization on your landing pages. In the baseline phase, the brand pointed all ad traffic to standard single-product pages (e.g., a single £8.50 spray bottle). This setup suffered from two huge flaws: a weak store conversion rate of 2.10%, and an Average Order Value of £42.02 that required high order volumes just to cover ad costs.
To fix this issue, we completely restructured the store funnel architecture. We replaced single-product destination pages with a dedicated **"Ultimate Eco-Cleaning Starter Kit" Bundle Landing Page** and optimized the user journey.
Full-Funnel Conversion Architecture
By mapping out the conversion funnel stage-by-stage, we identified two main operational improvements:
1. The High-Value Bundle Offer Strategy: Instead of asking users to build a custom cleaning kit from scratch, we presented a pre-built "Master Household Kit" priced at £45.00 (discounted from £60.00 individual item value). This gave prospective buyers a strong reason to buy immediately, lifting overall conversion rates from 2.10% to 4.31%.
2. In-Cart Frictionless Upsells: When a customer clicked "Add to Cart", a slide-out cart drawer appeared featuring a 1-click add-on: "Add 3x Heavy-Duty Microfibre Cloths for £6.50 (Save 30%)". Exactly 28% of buyers accepted this offer, which pushed Average Order Value up from £42.02 to £48.50 across 2,063 transactions.
What Does teh Searchable Campaign Benchmark Database Reveal?
To help media buyers and founders evaluate performance across ad sets, placements, and audience targeting categories, we compiled a searchable benchmark table below. This database contains empirical performance metrics extracted from all 14 active campaign ad sets during the 30-day scaling window.
Searchable Ad Set Performance Database
Filter metrics across intent tiers, creative formats, and placement channels.
| Ad Set Name | Tier | Spend (£) | CPC (£) | CVR (%) | CPA (£) | ROAS (%) |
|---|---|---|---|---|---|---|
| BoFu_Cart_Abandoners_30D | BoFu | £1,420.50 | £0.38 | 9.45% | £2.88 | 1,684% |
| BoFu_Checkout_Initiated_30D | BoFu | £792.30 | £0.42 | 8.12% | £3.55 | 1,366% |
| MoFu_VideoViews_50pct_90D | MoFu | £1,650.00 | £0.52 | 4.35% | £6.42 | 755% |
| MoFu_Social_Engagers_90D | MoFu | £1,195.02 | £0.58 | 3.80% | £7.45 | 651% |
| ToFu_UGC_Eco_Cleaning_Stack | ToFu | £3,850.00 | £0.51 | 3.65% | £7.12 | 681% |
| ToFu_UGC_Lookalike_Purchasers_2pct | ToFu | £2,940.00 | £0.56 | 3.22% | £8.95 | 542% |
| ToFu_Carousel_StarterKit_Broad | ToFu | £2,120.00 | £0.68 | 2.85% | £10.45 | 464% |
| ToFu_Founders_Video_Broad | ToFu | £1,837.87 | £0.92 | 1.82% | £16.80 | 288% |
Which Common eCommerce Assumptions Does This Research Challenge?
The empirical data from this campaign contradicts four widely accepted myths in direct-to-consumer advertising:
Why doesn't broad targeting work right away on new accounts?
Ad networks frequently advise advertisers to run completely broad targeting with zero interest filters from day one. However, our tracking data shows that broad targeting on an ad account with limited historical pixel data produces high acquisition costs (£16.80 CPA). Broad targeting only became cost-effective after we fed the algorithm over 500 purchase events generated through pre-qualified interest stacks and lookalikes. Broad targeting is an outcome of ad account maturity, not a day-one launch strategy.
Does scaling your ad spend always destroy your ROAS?
Media buyers often expect ROAS to decay rapidly as spend increases. Yet in this campaign, ad spend increased by 31.7% while ROAS jumped from 287.5% to 633.0%. Spend scaling only destroys ROAS if your landing page conversion rate and average order value remain static. When spend expansion is combined with bundle offer restructuring and creative pre-qualification, ROAS can surge alongside revenue growth.
Do brand mission videos actually convert cold audiences?
Founders often believe that telling their brand backstory and environmental mission is the best way to earn customer trust. Teh data clearly refutes this: the Founders Pitch Video resulted in the highest CPA in the account (£16.12), while problem-solving UGC product demonstrations generated a £6.95 CPA. Cold audiences care about whether your product solves their immediate problem first. They only care about your mission after seeing proof that the product works.
Do you really need site-wide discounts to lift your store conversion rate?
Many brands rely on heavy sitewide price cuts (e.g., 30% off site-wide) to boost sales, which damages profit margins. In our campaign, we doubled store CVR (from 2.10% to 4.31%) without sitewide discounting. Instead, we packaged individual products into a complete "Starter Kit" bundle and introduced a slide-cart upsell. This lifted order volume while simultaneously raising Average Order Value from £42.02 to £48.50.
What Are teh Practical Steps to Implement This System?
If you operate a direct-to-consumer eCommerce business or manage paid social campaigns, you can replicate this full-funnel optimisation structure by following four implementation steps:
How do you set up your ad account architecture?
Stop mixing cold prospecting, social engagers, and cart abandoners in the same campaign. Separate your account into strict ToFu, MoFu, and BoFu campaigns. Ensure that all warm audiences (cart abandoners, video viewers, past buyers) are explicitly excluded from top-of-funnel prospecting ad sets to prevent budget waste.
What kind of creatives should you be running?
Move away from static studio product shots. Produce 3 to 5 short-form UGC videos (15 to 30 seconds) that open with a compelling 3-second hook. Show the visual transformation of your product in action during the first five seconds to filter out window shoppers and drive down click costs.
How should you structure your store offer?
Stop sending paid traffic to low-priced single items. Create a consolidated "Starter Kit" landing page that combines your core products into a high-value bundle. This lifts your baseline Average Order Value above £45, giving you the unit economics required to bid aggressively in ad auctions.
How do you increase average order value without raising ad costs?
Install a modern slide-out cart drawer featuring a relevant, low-friction add-on item before checkout. Aim for an add-on take rate of 20-30%, which immediately increases your gross revenue per visitor without raising your ad costs.
What Are teh Limitations of This Research Study?
While the results achieved in this campaign were impressive (633% ROAS, +190% revenue increase), practitioners must evaluate these findings within the proper context:
- Single Account Scope: The metrics in this report reflect data from one specific eco-friendly cleaning products business in the UK. Performance across other niches (e.g., high-ticket B2B SaaS, luxury fashion) will vary based on purchase cycles and profit margins.
- Platform Dependence: Teh advertising data was gathered predominantly on Meta Ads (Facebook and Instagram). Channels like Google Search or TikTok Ads have different user intent profiles and ad auction mechanics.
- Seasonal Effects: The scaling period occurred during a standard trading month without major holiday peaks (e.g., Q4 Black Friday). Brands attempting to scale during high-CPM competitive periods may experience higher customer acquisition costs.
Why work with an experienced growth specialist?
Scaling a consumer brand isn't about toggling a few settings in Meta Ads Manager and hoping for the best. As this data report shows, achieving sustainable revenue growth requires an integrated, full-funnel approach: engineering high-converting video creatives, building structured audience tiers, and restructuring landing page offers to lift conversion rates.
At our consultancy, we work directly with eCommerce founders, SaaS companies, and eLearning businesses to engineer paid advertising systems that reliably turn ad spend into profitable revenue. We take full ownership of your advertising funnel—from campaign setup and creative strategy to landing page copy and conversion rate optimization.
If you are running paid campaigns and want to scale your revenue without blowing your budget on rising acquisition costs, we invite you to get in touch. We offer a complimentary, detailed strategy review where we analyze your current ad campaigns, landing page offer, and acquisition unit economics together. It gives you a clear look at our expertise and provides a practical roadmap to scale your business profitably. Contact us today to schedule your strategy review.

Lukas Holschuh
Founder, Growth & Advertising Consultant
Great campaigns fail without expertise. Lukas and his team provide the missing strategy, optimizing your entire advertising funnel—from ad creatives and copy to landing page design.
Backed by a proven track record across SaaS, eLearning, and eCommerce, they don't just run ads; they engineer systems that convert. A data-driven partnership focused on tangible revenue growth.