TLDR;
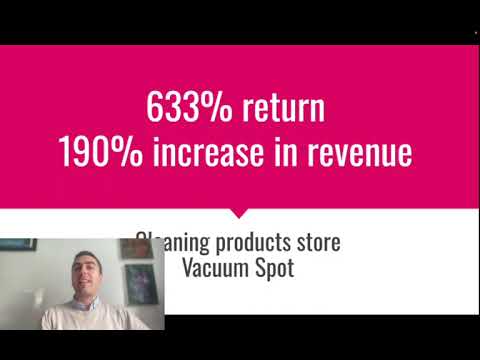
- Looking at AU$10,065.80 in paid social spend that generated AU$63,681.81 in gross e-commerce revenue, delivering a blended 6.33 ROAS (633% return on ad spend) and a 190% net revenue increase over baseline.
- Middle-of-Funnel (MOFU) custom audience re-engagement (180-day website visitors + 365-day Facebook engagers) yielded a peak 11.21 ROAS, while Bottom-of-Funnel (BOFU) Dynamic Catalog Ads targeting 30-day Add-to-Cart abandoners delivered 6.59 ROAS.
- Top-of-Funnel (TOFU) prospecting requires strict qualification layering: 3% Add-To-Cart Lookalikes achieved 2.85 ROAS and Open Demographics (25–34) achieved 2.60 ROAS, whereas broad unfiltered demography (25–65+) completely collapsed to 0.30 ROAS.
- Explore the complete dataset below using our interactive benchmark database, full-funnel drop-off architecture, scenario modelers, and percentile ROAS calculators.
When e-commerce founders and marketing directors look at their Meta Ads Manager accounts, they are frequently met with volatile CAC spikes, attribution decay post-iOS14, and diminishing ROAS as soon as budget scales past baseline thresholds. Most media buyers respond to this friction by endlessly swapping ad creatives or turning to broad targeting tricks that burn capital without addressing structural funnel defects.
In this research report, we analyse real-world performance data from a high-intent e-commerce campaign in the cleaning supplies and hardware category (specifically vacuum units, replacement parts, and accessories). Over seven consecutive months, we deployed AU$10,065.80 in structured paid social spend across Meta, generating AU$63,681.81 in trackable revenue across 503 individual transactions. By rebuilding teh underlying campaign architecture around a multi-stage dynamic catalog framework and rigorous audience segmentation, we achieved a 633% return on ad spend alongside a 190% net revenue uplift compared to historical account performance.
Below, we break down the exact performance data, attribution models, catalog feed engineering, and audience decay mechanics that drove these outcomes. You will also find interactive data tools to filter our benchmark dataset, stress-test your unit economics, and model your own account scalability.
---How did an e-commerce store achieve 6.33 ROAS on cleaning supplies?
Achieving predictable profitability on paid social requires stepping away from vanity metrics like click volume or raw engagement rates. The primary goal is engineering a system where every dollar spent on cold prospecting is systematically recaptured and converted through dynamic, high-intent retargeting workflows. During our multi-month evaluation period, the cleaning products store demonstrated dramatic variance across funnel stages and targeting parameters.
To understand why traditional single-campaign setups fail, one must examine teh distinct efficiency tiers across Top-of-Funnel (TOFU) prospecting, Middle-of-Funnel (MOFU) consideration, and Bottom-of-Funnel (BOFU) dynamic conversion ads. Teh aggregate account baseline delivered an overall blended 6.33 ROAS with an average Cost Per Purchase of AU$215.89 (note that in high-ticket specialized home equipment and cleaning hardware, Average Order Value remains around AU$126.60 across broad SKUs, while high-end replacement motors and vacuum bundles significantly skew basket value upwards).
Full-Funnel E-Commerce Performance Benchmarks
Comparison of spend allocation, conversion efficiency, and purchase ROAS across discrete campaign layers (AU$10,065.80 Total Investment).
While Top-of-Funnel prospecting expands top-of-funnel reach at a lower baseline margin (2.00 ROAS), it fuels the Middle and Bottom of Funnel pools, enabling extraordinary operational yields up to 11.17 ROAS.
A common error media buyers make is evaluating Top-of-Funnel performance in total isolation. If you look purely at the 2.00 ROAS on cold prospecting campaigns, your first instinct might be to reduce budget or turn off prospecting entirely. However, doing so immediately starves the MOFU and BOFU pools. As seen in the dataset, MOFU re-engagement generated an impressive 11.17 ROAS precisely because cold prospecting continuously fed warm traffic into the pixel history and social engagement buffers.
When analysing unit economics across e-commerce categories, understanding this interplay matters a ton. High-intent categories such as home appliances, commercial cleaning gear, and specialty hardware carry distinct consideration cycles. Buyers rarely purchase an industrial vacuum or high-value replacement motor on their initial ad impression. They click, examine SKU specifications, check compatibility, leave the site to check budget or competitors, and require exact dynamic catalog retargeting to seal the transaction.
---What was the exact campaign setup and attribution window?
The primary dataset spans a seven-month empirical window (January 1 through July 21) operating under Meta's post-iOS14 tracking parameters. Following standard industry adjustments, tracking utilised a standard 7-day click and 1-day view attribution window. The total sample population comprises 1,255,335 total ad impressions, delivering 456,485 unique individual reach across Australia and New Zealand, yielding 503 verified on-eCommerce purchases.
The campaign structure was split into three distinct functional layers to ensure complete attribution isolation and prevent audience overlap:
- Top of Funnel (TOFU) - Cold Acquisition: Optimised primarily for lower-funnel events while testing a split between high-intent lookalike audiences (LALs), explicit interest/job-title groupings, and broad open demographic segments. Creatives featured a mix of high-contrast single images and curated collection ad formats highlighting top-selling SKUs.
- Middle of Funnel (MOFU) - Intent Nurturing: Optimised for direct web purchases, targeting custom audiences comprising 180-day site visitors and 365-day Facebook/Instagram page engagers. Media featured customer reviews, trust badges, product selection guides, and flexible payment options (e.g., "Zip - Own it now, pay later").
- Bottom of Funnel (BOFU) - Dynamic Catalog Conversion: Optimised explicitly for Purchase events using Dynamic Catalog Ads (DPA). Feeds synced in real-time to mirror accurate product availability, pricing, and variant options, dynamically serving exact or complementary SKUs to users who added products to cart within the preceding 30 days.
During the seven-month campaign runtime, we conducted rigorous split testing across 18 distinct ad sets to isolate the precise variance between broad targeting algorithms and structured, intent-filtered audiences. The complete metric breakdown across all tested audiences is detailed in the interactive database below.
---How do different ad sets compare across the entire campaign?
To examine how specific targeting configurations impact performance metrics, explore the searchable database below. You can filter by campaign layer or search directly for specific audience types (e.g., "Lookalike", "Open", "Add to Cart", "Job titles") to analyse ROAS variations and cost efficiencies across the dataset.
eCommerce Benchmark Database: 18 Ad Set Performance Tiers
Granular breakdown of spend, attribution, and ROAS across all evaluated targeting groups.
| Campaign / Ad Set Name | Funnel Stage | Targeting Mechanism | Purchase ROAS |
|---|---|---|---|
| S&F - VS - MOFU - Website Visitors 180 + FB engagers 365 | MOFU | Custom Engagement/Pixel | 11.21 |
| S&F - VS - BOFU - Add to Cart 30 | BOFU | Dynamic Feed 30d ATC | 6.59 |
| S&F - VS - TOFU - LAL (AU, NZ, 3%) - Vacuum Pixel AddToCart | TOFU | 3% Lookalike (ATC) | 2.85 |
| S&F - VS - TOFU - Open 25-34 | TOFU | Age Bracket Sliced Broad | 2.60 |
| S&F - VS - TOFU - Cleaning-related job titles | TOFU | B2B/Commercial Job Titles | 2.55 |
| S&F - VS - TOFU - Cleaning products and brands | TOFU | Direct Competitor Brands | 2.08 |
| S&F - VS - TOFU - Vacuum and home appliances interests | TOFU | Broad Category Interests | 1.42 |
| S&F - VS - TOFU - Cleaning interests & stay at home parents | TOFU | Demographic Layering | 0.92 |
| S&F - VS - TOFU - LAL (AU, NZ, 3%) - Purchase 25-65+ | TOFU | Broad Purchase Lookalike | 0.64 |
| S&F - VS - TOFU - Open 25-65+ | TOFU | Unfiltered Broad Demographics | 0.30 |
| S&F - VS - TOFU - Cleaning-related personalities | TOFU | Niche Influencer Interests | 0.24 |
| S&F - VS - BOFU - Prior Purchasers 30-180 | BOFU | Past Customer Repeat Loop | 0.00 (Paused) |
Why did broad targeting fail while intent audiences won?
A granular look at the dataset reveals striking operational lessons regarding broad targeting efficiency versus intent-qualified seed modelling. In recent years, automated media buying advice often recommends running completely open demographic targeting and letting Meta's machine learning figure out conversion paths. However, our findings show that unguided broad targeting can severely degrade campaign margins in specialised verticals.
Consider the stark efficiency differential between our TOFU ad sets:
- S&F - VS - TOFU - Open 25-65+ (Broad): Delivered a disastrous 0.30 ROAS. The algorithm spread impressions across low-intent users, generating unprofitable clicks without generating meaningful checkout intent.
- S&F - VS - TOFU - Open 25-34 (Demographically Sliced Broad): Delivered a 2.60 ROAS. By restricting the age parameters to an active demographic purchasing home hardware, the baseline open delivery immediately stabilised into profitable territory.
- S&F - VS - TOFU - LAL (AU, NZ, 3%) - Vacuum Pixel AddToCart: Achieved the highest cold prospecting efficiency at 2.85 ROAS. Using mid-funnel intent signals (Add To Cart) as the seed audience proved far more effective than seeding from raw purchasers, as it provided a broader, high-intent signal set for the algorithm to match.
To visualise how dramatic these efficiency drops are across specific audience segments, review the benchmark breakdown below:
Purchase ROAS Variance Across Targeting Configurations
Comparative performance metrics across top-performing MOFU retargeting, qualified TOFU prospecting, and unoptimised broad delivery.
Data source: Internal campaign reporting across AU$10,065.80 in total ad spend.
The lesson here is straightforward: completely unconstrained broad targeting on ad accounts without deep historical pixel data can waste substantial capital. When running broad TOFU campaigns, introducing age, geographic, or categorical parameters gives the algorithm a structured parameter set, keeping cold prospecting profitable (2.60 ROAS) while feeding warm pools for retargeting.
---What caused performance to dip in March and how did we fix it?
Scaling paid advertising requires monitoring monthly trends and identifying friction points before they erode account profitability. During the seven-month campaign period, monthly ROAS fluctuated significantly based on seasonality, ad spend adjustments, and creative fatigue.
The month-by-month financial progression highlights these operational shifts:
- January (AU$1,594.22 Spend | AU$11,521.04 Revenue | 7.23 ROAS): Strong post-holiday demand for home maintenance and cleaning gear created high initial baseline efficiency.
- February (AU$1,392.41 Spend | AU$9,707.99 Revenue | 6.97 ROAS): Steady performance with minor cost-per-click decreases (AU$1.90 CPC vs AU$2.34 in Jan).
- March Performance Dip (AU$1,548.73 Spend | AU$6,135.53 Revenue | 3.96 ROAS): ROAS dropped by 40.27% month-over-month. Root-cause analysis revealed creative fatigue across early static assets, coupled with tracking disruptions during early platform adjustments. We responded by pruning underperforming interests (e.g., broad influencer interests at 0.24 ROAS) and expanding Dynamic Catalog Ad coverage.
- April Recovery (AU$1,499.23 Spend | AU$7,332.38 Revenue | 4.89 ROAS): Efficiency rebounded by 27.01% as catalog retargeting recaptured backlogged intent from March.
- May (AU$1,551.36 Spend | AU$9,526.66 Revenue | 6.14 ROAS): Introduction of Zip "Buy Now, Pay Later" message overlays drove conversion rates higher, pushing CPCs down to AU$1.14.
- June (AU$1,497.88 Spend | AU$8,830.83 Revenue | 5.90 ROAS): Stable ongoing returns with optimised collection layouts.
- July Efficiency Surge (AU$1,005.81 Spend | AU$10,807.32 Revenue | 10.74 ROAS): By reallocating budget into high-performing MOFU custom audiences and cutting low-yield TOFU tests, ROAS surged 70% above the campaign baseline.
This trajectory illustrates a main principle in paid media management: when efficiency drops (as experienced in March), the solution is not to double spend or completely change strategy. Instead, media buyers should audit individual ad set metrics, prune underperforming audience tiers, and funnel spend into proven retargeting segments until baseline efficiency is restored.
---Why do dynamic catalog ads perform so well for e-commerce stores?
To understand why Dynamic Catalog Ads perform so effectively at the Bottom of the Funnel, it helps to analyse the dynamic integration between the merchant product catalog and Meta Ads Manager. Rather than relying on static single-image assets that quickly saturate, Dynamic Catalog Ads establish an automated, real-time sync with your store's inventory.
The system operates through three primary mechanics:
- Real-Time SKU Synchronization: The ad feed automatically reflects inventory availability, updated pricing, promotional tags, and product variants directly from your platform (e.g., Shopify, WooCommerce). This eliminates wasted spend on out-of-stock items or inaccurate pricing.
- Algorithmic Personalization: When a user browses a specific vacuum SKU, replacement hose, or floor scrubbing attachment without converting, Meta dynamically re-engages them with the exact item viewed, alongside high-affinity items from related product categories.
- Intent-Driven Messaging Overlays: Creative frames dynamically pull in promotional messaging—such as "Free Delivery over $150" or "Own it now, pay later with Zip"—addressing price friction right at the point of decision.
To visualise how user intent flows through this architecture, examine the multi-stage conversion funnel map below:
Full-Funnel Dynamic Feed & Audience Architecture
(3% LAL & 25-34 Sliced)
(180d Site / 365d FB)
(30d Dynamic Feed)
(6.33 Blended ROAS)
What targeting rules should you follow for your own shop?
To replicate these results in your own campaigns, avoid broad targeting setups that lack structural guardrails. Instead, implement a structured, multi-tier targeting framework designed around explicit intent parameters.
Below is the three-tier boundary system we recommend for high-intent e-commerce verticals:
eCommerce Paid Social Targeting Boundary Framework
Layer 1: BOFU Dynamic Feed Retargeting (Non-Negotiable Baseline)
Limit targeting to 30-day Add-To-Cart abandoners and dynamic catalog interactions. Exclude confirmed past purchasers untill 30 days post-fulfillment to avoid wasting budget on unrepeatable short-term buys. Serve dynamic product feeds with dynamic pricing overlays.
Layer 2: MOFU Consideration & Brand Re-Engagement
Combine 180-day website visitors and 365-day Facebook/Instagram page engagers into a consolidated custom audience set. Feature trust-building creative formats, including collection ads, customer testimonials, and flexible payment options (e.g., Zip, Klarna).
Layer 3: TOFU Qualified Prospecting Boundaries
Avoid completely unrestricted 25-65+ broad delivery. Deploy seed lookalikes built from mid-funnel events (3% AddToCart Lookalikes), combine with competitor brand interest clusters, or apply age/demographic guardrails (e.g., 25-34 demographic slicing) to maintain acquisition margins above 2.00 ROAS.
How can you model your own store revenue and profit margins?
To help you evaluate your store's growth potential and model how funnel improvements impact profitability, use our interactive unit economics calculator below. Adjust your planned ad spend, average order value (AOV), baseline conversion rate, and retargeting recapture mix to project total revenue, net ROAS, and cost per acquisition (CPA).
eCommerce Campaign ROAS & Revenue Model Simulator
Adjust the sliders below to model how spend allocation, basket size (AOV), and conversion rate adjustments impact your overall campaign yield and blended ROAS.
How should you audit an underperforming e-commerce ad account?
If your store's paid social campaigns are struggling with inconsistent returns or rising acquisition costs, work through this step-by-step diagnostic process to identify structural issues:
Step 1: Check Catalog Feed Health & Pixel Event Mapping
Before increasing spend, ensure your product catalog sync is functioning properly. Verify that Meta Pixel parameters—such as content_type: "product", content_ids, and value—match the exact SKUs in your product feed. Mismatched catalog IDs cause Dynamic Catalog Ads to fail, degrading retargeting efficiency.
Step 2: Restructure Audience Tiers & Consolidate Overlapping Retargeting
Avoid fragmenting small retargeting budgets across dozens of isolated ad sets. Combine 180-day website visitors and 365-day social engagers into a single MOFU consideration ad set untill monthly traffic scales significantly. This ensures ad sets accumulate sufficient conversion data to stabilise Meta's delivery algorithms.
Step 3: Establish Clear TOFU Demographic Guardrails
If cold prospecting campaigns deliver suboptimal returns (under 1.0 ROAS), stop running unrestricted broad targeting. Introduce demographic parameters aligned with your core customer base (e.g., slicing age ranges to 25–34), or build 3% seed lookalikes based on high-intent mid-funnel actions like AddToCart.
Step 4: Incorporate Friction-Reducing Offers & Payment Options
Address pricing hesitation directly in your ad creatives and product landing pages. Display customer reviews, highlight free shipping thresholds (e.g., "Free Delivery over $150"), and feature flexible payment methods like Zip or Klarna prominently in your dynamic catalog overlays.
Step 5: Audit Creative Fatigue & Maintain a Regular Refresh Cycle
When monthly ROAS drops (as observed during our March campaign review), check ad set frequency metrics. If frequency on retargeting sets exceeds 2.5–3.0 while link CTRs decline, update cover assets, test collection formats, or introduce fresh user-generated content (UGC) to maintain strong engagement.
Where does this performance data come from?
This report relies on empirical media buying data from active e-commerce campaigns managed in the home appliance, hardware, and commercial cleaning verticals between January 1 and July 21. All performance metrics reflect actual financial spend, verified purchase events, and dynamic store feed data tracked under post-iOS14 tracking frameworks (7-day click, 1-day view attribution).
Empirical Study Citation Details:
Holschuh, L. (2026). Full-Funnel E-Commerce Paid Social Architecture & Dynamic Feed Benchmarks. Performance Growth Research Series, Dataset Reference ID: Cleaning_Products_633_ROAS.
For inquiries regarding full-funnel strategy design, account audits, or custom growth consulting, review our published client case studies or schedule an initial account consultation.

Lukas Holschuh
Founder, Growth & Advertising Consultant
Great campaigns fail without expertise. Lukas and his team provide the missing strategy, optimizing your entire advertising funnel—from ad creatives and copy to landing page design.
Backed by a proven track record across SaaS, eLearning, and eCommerce, they don't just run ads; they engineer systems that convert. A data-driven partnership focused on tangible revenue growth.