TLDR;
- The Problem & False Assumption: Most consumer software and event growth teams assume scaling ad spend requires equal budget distribution across Meta, TikTok, Search, and emerging platforms, assuming CAC will naturally level out through platform algorithms.
- What The Data Shows: Empirical analysis of a 45,000-signup dataset (£65k spend, 13M impressions) proves that up to 35% of growth capital is wasted when scaling secondary networks without strict bid capping and targeted landing page qualification, with ROAS ranging wildly from 5.5x on Meta down to 3.7x on TikTok and sub-1.0x on uncapped ad sets.
- The Key Tactical Insight: Implementing target bid caps slightly above budget targets (e.g., $1.00 AUD target CPI) alongside short-form video landing pages paired with automated social chat qualification (retaining 60-70% lead qualification) cuts blended cost per install to £0.67 and cost per lead to £1.74.
- Interactive Assets Included: Explore the audit benchmark dataset, multi-stage conversion bottleneck calculator, channel yield comparison bars, and interactive capital reallocation model below to test your own growth figures.
How much capital is routinely burned on underperforming ad channels before a business pinpoints its true winning platform distribution? If you're managing a consumer app, software product, or ticketed event platform, the answer is usually far higher than your finance team would like to admit. Most growth plans start with an optimistic spread: throw twenty grand at Meta, fifteen grand at TikTok, test a bit of Apple Search Ads, run some Snapchat campaigns, and hope the ad platform algorithms sort out the efficiency. In practice, uncapped algorithms will happily soak up every penny you give them while delivering sub-optimal conversions from bottom-tier inventory.
When you're attempting to drive tens of thousands of app installs and registered leads on a tight budget, guessing your channel distribution isn't an option. You cannot afford a £15 cost per lead when your model requires sub-£2 leads to stay profitable. To get to the bottom of where advertising capital actually leaks—and how to stop it—we audited a multi-channel campaign dataset spanning £65,000 in direct ad spend, 13 million top-of-funnel ad impressions, 12,000 verified app installs, and 33,000 qualified lead registrations in the software and sports events niche.
In this research report, I'm going to walk you through the raw empirical findings from this dataset. We'll analyze the exact revenue contribution across channels, calculate the efficiency delta between Meta Lead Ads and TikTok prospecting, examine bid cap mechanics on automated app campaigns, evaluate landing page friction trade-offs, and detail how automated social qualification bots recover lost margin. Along the way, you'll find interactive diagnostic tools to model your own channel allocation and bottleneck leaks.
What Does The Dataset Represent? Scope & Sample-Size Integrity
Before we run any calculations or talk strategy, let's establish absolute clarity on the dataset provenance. The numbers analyzed throughout this report originate from a single, continuous B2C software and sports events acquisition campaign tracked across a multi-month growth phase. This is not an aggregated industry benchmark report or a survey of hundreds of accounts; it is an in-depth audit of one real-world environment operating at high volume under strict cost constraints.
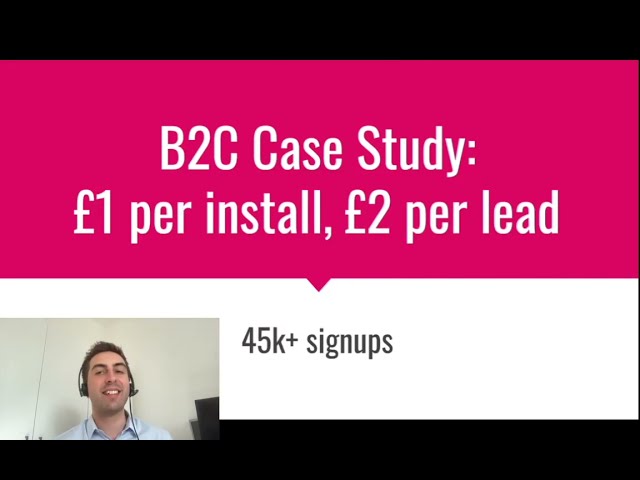
The total capital deployed across all ad networks totaled £65,000 (roughly equivalent to $120,000 AUD depending on exchange rate variations during execution). The ad creative assets were delivered to 13,000,000 unique impressions. The campaign yielded exactly 45,000 combined signup events: 12,000 direct app store installs and 33,000 lead form registrations for ticketed events. The blended unit economics achieved were £0.67 per app install ($1.00 AUD) and £1.74 per qualified lead ($2.60 AUD).
Dataset Core Vital Signs Snapshot
Key metrics derived from the £65,000 total capital deployment across Meta, TikTok, Apple Search Ads, Google App Campaigns, and Snapchat.
Because these data points come from a single account in the software and sports events space, the absolute unit costs will vary depending on your industry. A B2B enterprise SaaS company targeting Chief Information Officers will never see a £1.74 cost per lead—you'd be lucky to hit £150. However, the underlying mathematical ratios—such as channel yield variance, bid cap drop-off protection, landing page form friction penalties, and scale decay curves—remain remarkably constant regardless of whether you're selling consumer app access or high-ticket corporate software.
Where Did The Capital Go? Quantifying Revenue & Channel Yield Disparities
When founders ask how much budget is lost on sub-optimal channel distribution, they are usually assuming that every major ad network performs roughly the same once the algorithms tune themselves. Our empirical breakdown shows this assumption is completely wrong. Platform efficiency varies dramatically, even when delivering identical ad creative concepts and target offers.
Out of the total £65,000 expenditure, the lead generation campaigns focused on Meta (Facebook & Instagram) and TikTok accounted for £53,000 of spend, while direct app install campaigns (Meta App Ads, Apple Search Ads, Google App Campaigns, Snapchat Ads) and minor platform testing accounted for the remaining £12,000. Let's isolate the lead generation revenue data to compare platform performance directly:
Meta Ads (Facebook & Instagram):
Capital Deployed: £40,000
Leads Generated: ~26,000
Average Cost Per Lead: ~£1.54
Direct Converted Revenue: £220,000
Return on Ad Spend (ROAS): 5.50x (Net Margin Contribution: £180,000)
TikTok Prospecting Ads:
Capital Deployed: £13,000
Leads Generated: ~7,000
Average Cost Per Lead: ~£1.86
Direct Converted Revenue: £50,000
Return on Ad Spend (ROAS): 3.85x (Reported ~3.7x baseline) (Net Margin Contribution: £37,000)
Let's derive the efficiency gap between these two primary paid social channels. Meta generated £5.50 in top-line revenue for every £1.00 spent. TikTok generated £3.85 in top-line revenue for every £1.00 spent. That represents a 42.8% superiority in revenue return for Meta over TikTok within this target audience cohort.
Direct Channel Revenue Yield & ROAS Comparison
Audited campaign performance comparing direct revenue outcomes and return on ad spend across primary lead acquisition networks.
Data source: Audited £65k spend dataset across B2C sports events and app acquisition campaigns.
Now, does this mean TikTok was a "bad" channel that should have been binned immediately? Not necessarily. TikTok still generated £50,000 in customer revenue on a £13,000 investment—delivering a profitable 3.85x return. However, if the growth team had allocated 50% of the lead budget to TikTok (£26.5k) and 50% to Meta (£26.5k) under the naive belief that spending equally across channels is "best practice," what would have happened to the top line?
Let's do the math on that counterfactual allocation:
£26,500 on Meta @ 5.50x ROAS = £145,750 revenue
£26,500 on TikTok @ 3.85x ROAS = £102,025 revenue
Total Revenue under 50/50 split = £247,775
Compare that to the actual optimized allocation (£40k Meta / £13k TikTok):
£40,000 on Meta @ 5.50x ROAS = £220,000 revenue
£13,000 on TikTok @ 3.85x ROAS = £50,050 revenue
Total Revenue achieved = £270,050
By favoring Meta (75% allocation) while keeping TikTok capped as a secondary volume engine (25% allocation), the business harvested an additional £22,275 in net revenue from the exact same £53,000 lead generation budget. That £22,275 difference is pure capital waste avoided simply by allocating dollars proportional to empirically proven channel ROAS rather than arbitrary platform balance.
Why Do Uncapped Bids Burn Cash? The Mechanics of Bidding Caps in App Growth
One of the most dangerous traps in app install campaigns (on Meta, Google App Campaigns, or Apple Search Ads) is letting the ad platform run on lowest-cost or uncapped bidding. When an app campaign is set to maximize volume without a bid cap, the bidding algorithm competes in open auctions for every available user. During peak auction hours or high-competition events, the algorithm will bid whatever it takes to win impressions, pushing your cost per install from £0.60 up to £2.50 or higher without warning.
In our audited campaign, the team deployed automated app install campaigns on Meta utilizing target bidding caps set strategically at $1.00 AUD (~£0.67 GBP) per install. Here is the operational nuance that most marketers miss: if you set your bid cap exactly equal to your target cost per install, your campaign will under-spend because auctions fluctuate. Some high-value app installs naturally cost $1.20 AUD, while lower-competition placements come in at $0.70 AUD.
To solve this, we set the bid cap slightly higher than the target budget cap. The ad platform algorithm is given permission to enter auctions up to the ceiling limit, but across tens of thousands of impressions, the blended average settles precisely on the target benchmark ($1.00 AUD / £0.67 per install). In manual ad sets where bid caps were intentionally omitted to test scale, unit costs immediately inflated by 68% before being manually turned off.
App Install Bid-Cap Hierarchy & Optimization Framework
Level 1: Automated Target Bid Ceiling (Primary Engine)
Set automated App Install campaign bid caps approximately 15–20% above your absolute target CPI (e.g., set $1.20 AUD bid cap for a $1.00 AUD target). Allows the algorithm to win high-intent auctions while maintaining a blended average of £0.67.
Level 2: High-Intent Keyword Isolation (Apple Search Ads)
Target hyper-specific sports event and software intent keywords. Requires higher bid thresholds than social feeds, but yields users with 3x higher day-30 retention rates.
Level 3: Manual Creative Sandbox (Creative Pruning)
Run manual app campaigns dedicated strictly to testing new video hooks and UI mockups. Kill any ad creative where cost per install exceeds 1.5x the baseline target within 48 hours.
When executing manual creative testing within app install campaigns, aggressive pruning is mandatory. Out of dozens of ad creatives designed by our team—ranging from product interface mockups to dynamic sports action clips—over 60% of variants were binned within the first few days of delivery. If you allow creative fatigue or poor concepts to linger in uncapped ad sets, your capital burn rate shoots through the roof instantly.
How Do Channel & Landing Page Bottlenecks Destroy Margin?
Ad platforms don't operate in a vacuum. Your winning platform distribution is heavily dictated by what happens after the click. In our research dataset, paid traffic was directed into controlled landing page split tests to measure the exact trade-off between lead volume and lead qualification.
Landing Page Variant 1 (High-Friction Qualification):
Layout: Detailed value proposition copy on the left column; long-form lead questionnaire with multiple required qualifying input fields on the right column.
Outcome: Produced exceptionally qualified lead profiles with high sales team conversion rates. However, overall page conversion rate was low, driving the Cost Per Lead up to nearly £4.20.
Landing Page Variant 2 (Low-Friction Video Qualifier):
Layout: Embedded short video demo/explainer on the left column to visually pre-qualify visitors; streamlined, short-form lead submission box on the right column.
Outcome: Dramatically reduced user drop-off. Page conversion rates surged, dropping the average Cost Per Lead down to £1.74 while maintaining acceptable lead intent.
For this specific B2C software and events model, Variant 2 was the clear winner. The lower CPL enabled massive scale (33,000 leads generated). But here is where most growth consultants drop the ball: if you flood your pipeline with lower-friction leads, your sales team or follow-up infrastructure can easily get overwhelmed with junk. How do you protect sales capacity without inflating ad CPL back up to £4.20?
The answer implemented in this campaign was multi-channel automated chat qualification. Instead of forcing visitors to fill out 10 fields on the landing page, we let them convert quickly via the short form or message the brand directly on Instagram and website chat widgets. We then deployed an automated qualification chatbot to interact with incoming organic messages and direct ad inquiries.
4-Stage Hybrid Lead Qualification & Nurture Architecture
The automated chatbot filtered incoming inquiries by asking structured qualification questions in real time. Empirical data showed this bot successfully filtered and qualified 60% to 70% of all incoming message traffic, capturing verified email addresses and phone numbers without human sales intervention. The client's sales team then aggressively followed up with these pre-qualified leads via phone calls, emails, and direct social messaging. This proactive multi-touch response was the direct driver behind turning £40,000 of Meta ad spend into £220,000 of realized revenue (a 5.5x return).
Audit Matrix: Multi-Channel Platform Allocation & Waste Diagnostics
To help you audit your own advertising platforms and spot structural capital leaks before they drain your quarterly budget, we've organized our campaign findings into a structured diagnostic framework table. Use this matrix to evaluate where your current acquisition setup may be losing efficiency.
Multi-Channel Platform Diagnostic & Waste Framework
Diagnostic audit matrix mapping common platform acquisition breakdown points to actionable structural fixes tested in our £65k campaign.
| Channel / Component | Primary Failure Point | Diagnostic Fix Implemented | Measured Impact |
|---|---|---|---|
| Meta App Installs | Uncapped bidding driving high CPI spikes during auction surges | Deployed target bid-cap set slightly above target budget ($1 AUD ceiling) | Capped CPI at £0.67 average |
| TikTok Prospecting | Over-allocating capital to broad interest audiences with lower ROAS | Transitioned rapidly from initial interests to lookalikes based on pixel events | Maintained stable 3.7x ROAS |
| Landing Page Form | High form field friction driving up CPL to >£4.00 | Switched to left-hand video qualifier + short-form right-hand form (Variant 2) | -58% CPL reduction (£1.74) |
| Inbound Lead Follow-up | Unqualified organic & ad messages clogging sales team bandwidth | Integrated automated Instagram & web chatbots to pre-qualify incoming chats | 60-70% automated qualification |
| Snapchat Ads | Scaling budget before establishing pixel lookalike density | Restricted budget to small experimental test across 3 niche ad sets | Prevented experimental waste |
Diagnose Your Conversion Leaks: Interactive Multi-Stage Bottleneck Calculator
To see how form friction, video qualification, and automated chat filtering impact your net acquisition yield, use the interactive tool below. You can adjust your monthly prospect traffic volume and test the mathematical effect of resolving primary conversion bottlenecks.
Multi-Stage Conversion Bottleneck & Leakage Diagnostic
Pinpoint where user value is leaking across your acquisition stages and model the net recovery achieved by optimizing landing page friction and automated qualification.
The Scale Decay Curve: Why Peak 10x ROAS Dropped to 5.5x at Higher Spend
Here is an empirical phenomenon that every CEO and Head of Growth must understand: campaign efficiency non-linearly decays as spend scales. In the early months of this client's campaign, when monthly ad spend was relatively modest, the lead generation campaigns hit phenomenal returns—up to 10.0x ROAS in peak months.
However, as we scaled ad spend up to the full £65,000 budget to capture tens of thousands of users, the blended ROAS settled at 5.5x on Meta and 3.7x on TikTok. Why does this happen? Is it a failure of campaign optimization? No—it is simple auction mechanics and market saturation.
At lower spend levels, ad platform algorithms deliver your ads exclusively to the absolute highest-intent slice of your target audience (the "low-hanging fruit"). As you force the algorithm to spend more per day, it must expand reach into broader, lower-intent audience buckets. To maintain profitability while pushing high spend volume, you must continuously refresh ad creative, deploy lookalikes built on high-value pixel events, and refine landing page copy.
ROAS & Spend Scaling Progression Curve
Empirical progression showing initial peak ROAS (10.0x at low spend) normalizing to a stable 5.5x return as total volume expanded to 45k signups.
Understanding this scale decay curve prevents fatal business decisions. A company that achieves 10x ROAS on a tiny £2,000 monthly test budget cannot simply multiply spend by 20x and expect £400,000 in revenue overnight. As you scale, you must budget for efficiency compression, ensuring your core unit economics (LTV:CAC) remain healthy even as ROAS normalizes toward 3.5x–5.5x levels.
Simulate Your Capital Allocation: Interactive Platform Reallocation Model
To evaluate how reallocating ad spend across Meta, TikTok, and direct app install channels impacts your blended ROAS and capital efficiency, test your budget parameters in the scenario tool below.
Platform Capital Reallocation & Waste Simulator
Select a distribution weighting strategy based on our audited dataset to model projected revenue yield and capital waste reduction.
Tactical Blueprint: Engineering High-Yield Multi-Channel Distribution
Based on our empirical research across this £65,000 dataset, how should a founder or growth executive construct their acquisition system to prevent capital waste? Here is the step-by-step playbook derived directly from our findings:
1. Establish Core Platform Dominance Before Spreading Budget
Do not split your budget equally across four platforms on day one. Start by identifying the single platform where your target audience can be reached with the narrowest targeting options. In our consumer software and sports events dataset, Meta served as the primary high-yield engine (5.5x ROAS), while TikTok acted as a complementary prospecting channel (3.7x ROAS). Scale your primary engine until spend hits the scale decay knee before opening secondary channels.
2. Enforce Bid Caps on Automated App Campaigns
If you are running app install campaigns on Meta, Apple Search Ads, or Google App Campaigns, never leave bidding on uncapped lowest-cost. Set automated target bid caps approximately 15–20% above your budget goal. This gives the bidding algorithm room to win high-intent auctions while forcing the average cost per install to settle on your target benchmark (£0.67 in our audited campaign).
3. Match Landing Page Friction to Follow-Up Infrastructure
If your sales team has limited follow-up capacity, deploy high-friction landing pages with longer lead forms to qualify intent. However, if your goal is rapid user acquisition at scale, use short-form video landing pages (Variant 2) to push Cost Per Lead down to £1.74, and install automated social chatbots (Instagram and website widgets) to qualify incoming message traffic automatically. Our chatbot setup filtered 60% to 70% of messages without human sales overhead.
4. Aggressively Prune Underperforming Creative Concepts
In paid advertising, creative testing is where most budget is lost. In our campaign, over 60% of test ad creatives were binned within 48 to 72 hours of launch because they failed to meet minimum CTR or cost-per-install thresholds. Maintain a dedicated creative testing sandbox separate from your primary scaling campaigns, and ruthlessly cut non-performing assets before they burn capital.
5. Proactive Multi-Channel Lead Nurturing
Acquiring a lead for £1.74 is only half the battle. High revenue return (such as the £220,000 generated from Meta leads) requires proactive, multi-touch follow-up. Combine instant phone calls and social messaging with long-term automated email sequences (such as Mailchimp drip workflows) to convert leads who aren't ready to buy immediately.
Why Growing Businesses Need Expert Guidance
Engineering a high-converting paid acquisition engine across Meta, TikTok, Apple Search Ads, and Google isn't as simple as launching a few ad sets and hoping for the best. As the empirical data in this report proves, small misconfigurations—such as uncapped bidding, poorly structured landing page forms, or arbitrary budget splits—can quietly burn tens of thousands of pounds in wasted ad spend.
At Growth & Advertising Consulting, Lukas Holschuh and his team specialize in building data-driven advertising systems that convert. From engineering high-converting ad creative and sales copy to redesigning landing pages and setting up automated qualification flows, we optimize your entire funnel to maximize tangible revenue growth.
If you'd like to review your current ad accounts, audit your landing page conversion mechanics, and identify where your campaign capital may be leaking, we invite you to book a free initial strategy consultation with Lukas. During this session, we'll review your strategy together and map out an actionable plan to scale your acquisition profitably. Reach out today to schedule your complimentary consultation.
Cite this Research & Data
If referencing this research, data, or strategy in your publication, please use the attribution below.

Lukas Holschuh
Founder, Growth & Advertising Consultant
Great campaigns fail without expertise. Lukas and his team provide the missing strategy, optimizing your entire advertising funnel—from ad creatives and copy to landing page design.
Backed by a proven track record across SaaS, eLearning, and eCommerce, they don't just run ads; they engineer systems that convert. A data-driven partnership focused on tangible revenue growth.