What should you know upfront?
- Your problem isn't one single "cart abandonment rate." You're likely assuming it's a single issue when it's actually a series of distinct leaks in your checkout process.
- The data shows that for premium products, shoppers are less spooked by the initial price and more by unexpected costs and friction right before they pay. Shipping fees and clunky forms are conversion killers.
- The main tactical insight is to stop thinking about abandonment as a single metric and start diagnosing it as a multi-stage funnel. Fixing the single biggest leak point—often shipping costs or payment friction—can have a massive impact on revenue.
- Below, I've built some diagnostic tools, including a checkout leak simulator, to help you find where your money is disappearing.
So, you’re selling premium eco-friendly cleaning stuff. People are adding it to their cart, they seem keen, and then... they just vanish. It’s a common story, and most people will tell you to look at your "cart abandonment rate." Honestly, that's pretty useless advice. It’s like a doctor telling you you’re unwell without finding out why. Staring at a single, blended percentage for cart abandonment doesn't tell you anything actionable.
The real question isn't that they're leaving, but where and why. Is it the moment they see the shipping cost? The second they're asked to create an account? Or when your payment form looks a bit dodgy on their mobile? Each of these is a completely different problem with a different solution. For a premium brand, the experience of paying should feel as good as the product itself. Any friction breaks that promise.
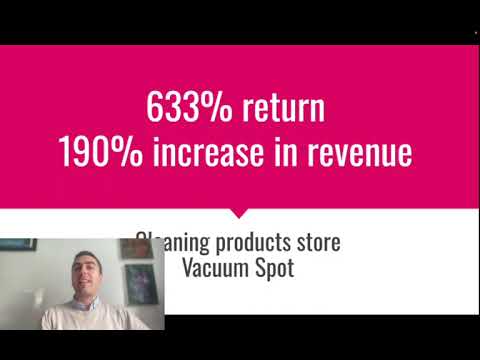
Over the years, we've had to get pretty thorough about this for our eCommerce clients. I remember one cleaning products company we worked with. Their ads were doing well, loads of add to carts, but the sales just weren't matching up. We dug in, ignored the overall abandonment number, and instead mapped their entire checkout journey, step-by-step. By finding and fixing just two specific leaks in that process, we managed to boost their revenue by 190% and deliver a 633% return on their ad spend. It wasn't about a big, revolutionary change; it was about a systematic, data-led diagnosis.
In this article, I’m going to walk you through that exact diagnostic process. We're going to treat your checkout like a crime scene and figure out where the value is bleeding out. I'll share the frameworks we use and I’ve even built a few interactive models based on real campaign data to show you the financial impact of these leaks. Forget the generic advice. Let's get to the root of it.
Is it one problem, or a dozen tiny cuts?
Before you can fix anything, you have to stop thinking of checkout as a single step. It's a mini-funnel with its own stages, and customers can drop off at any point. Most analytics platforms, if you set them up right, can show you this. For a typical eco-friendly brand selling direct, the journey looks something like this:
A user sees your ad, clicks through, lands on a product page, adds a bottle of your fancy multi-surface cleaner to their basket. They are now in the checkout funnel. The first mistake people make is thinking this is one simple process. It's not. It's a sequence of hurdles you're asking them to jump.
We need to map it out. What does that journey actually look like? It's usually something like this: User views the cart page, then clicks Checkout. They land on a page asking for their email and shipping address. Then a page to confirm shipping method. Then a page for payment details. And finally, the Confirm Order button. Each arrow in that process is a point where you can lose someone. And usually, one of those drop-offs is far bigger than the others.
A typical flow looks like this. The drop-off percentages I've put in are illustrative, based on what we often see in new client accounts before we start optimising. The real numbers are sitting in your own analytics, you just have to go and find them.
The Checkout Micro-Funnel
Looking at that, the big scary numbers aren't at the start. They're at the Select Shipping and Payment stages. This is where the investigation has to focus. It tells us the problem is less about the product or the initial price, and more about the mechanics of the transaction itself. People are bought into your product, but something in the process of paying for it is putting them off. Our job is to find out what.
Is it the price, or the surprise?
The first and most common culprit, especially for physical products, is shipping. With premium eco-friendly formulations, customers have already accepted a higher price point for the product itself. They're paying for quality, for ethical sourcing, for sustainability. They get it. What they have not agreed to is a surprise £5.99 fee tacked on at the last second. It feels like a cheap trick, and it completely undermines the premium feel of your brand.
We see this constantly. A customer is happy to pay £30 for a starter kit. But when that £30 becomes £35.99 on the final step, it breaks their mental model of the price. The absolute amount isn't the issue; it’s the psychological sting of an unexpected cost. Amazon has trained an entire generation of consumers to expect shipping to be free, or at least bundled into a subscription like Prime. As a smaller brand, you're fighting that expectation whether you like it or not.
The usual objection I get from founders is, "But I can't afford to offer free shipping." The real question is, can you afford not to? Often, the increase in conversion rate from offering free shipping more than pays for the cost of the shipping itself. You might have to slightly increase your product prices to absorb the margin hit, but customers are far more receptive to a £32 product with free shipping than a £30 product with a £2 surprise shipping fee. It's about framing the total cost transparently from the start.
Let's run the numbers. Use this calculator to model the impact. I've pre-filled it with some typical figures for a direct-to-consumer brand. The Stage 2 Retention is the percentage of people who see the shipping costs and still proceed to payment. See what happens to your final number of sales when you fix that leak, even if it costs you a bit on each order.
Shipping Cost Bottleneck Diagnostic
See how unexpected shipping fees create a massive leak, and model the revenue recovery from offering free shipping.
Are you making it hard for people to give you money?
Once you’ve sorted the shipping shock, the next biggest killer of conversions is friction. Pure and simple logistical hassle. You have a motivated buyer with their card in hand, and you proceed to make them jump through hoops. It’s madness, but it happens all the time.
The number one sin here is forcing account creation. "Create an account to continue." Why? What possible benefit does that offer the customer in that moment? None. It's a barrier, plain and simple. It signals that you value your marketing list more than their time and their purchase. Always, always, always offer a guest checkout.
Then there's the form itself. How many fields are you making them fill out? Name, email, address line 1, address line 2, city, county, postcode, country, phone number... it's exhausting. Each additional field you require is a tiny reason for someone to give up. Especially on a mobile phone, where typing is a pain. Is address line 2 really mandatory? Do you truly need their phone number right now? Strip it back to the absolute bare minimum you need to process the order.
The biggest win in reducing friction is express checkout options. Apple Pay, Google Pay, Shop Pay, PayPal. These services store the user's shipping and payment information securely. When a customer sees that button, it means they can buy your product with a thumbprint or a face scan. It turns a two-minute, 15-field form into a two-second, single-click transaction. For a premium brand, offering this kind of seamless, modern experience isn't a nice-to-have; it's a core part of the brand promise. You're selling effortless quality in your products, so your checkout needs to reflect that.
We can think of this as a hierarchy of needs for a low-friction checkout. You have to get the basics right before you even think about the finer details.
The Checkout Friction Audit Framework
Layer 1: The Foundations (Non-Negotiable)
Guest Checkout: Never force account creation. Express Payment Options: Apple Pay, Google Pay, Shop Pay, PayPal must be visible and prominent.
Layer 2: Smart Optimisations
Address Auto-Complete: Use tools like Google Places API to fill the address from the first line and postcode. Minimal Form Fields: Remove any field that isn't absolutely required for delivery and payment.
Layer 3: The Premium Experience
Saved Details for Returners: Recognise returning customers and pre-fill their info. Single-Page vs Multi-Step: Test what works best for your audience. Sometimes a clean multi-step process feels less intimidating than one long form.
The financial upside here is immense. Imagine you spend money on ads to get clicks. Let's say you spend £2,000 a month at an average cost-per-click of £1.00. That's 2,000 visitors. If your clunky, high-friction checkout only converts 10% of people who add to cart, and only 20% of visitors add to cart, your final conversion rate is a dismal 2%. That's 40 sales. Your cost per acquisition (CPA) is £50. But if you fix the friction and that checkout conversion rate doubles to 20%—a totally realistic target—you now get 80 sales for the same ad spend. Your CPA is now £25. You've halved your acquisition cost without ever touching your ads. It's the cheapest and most effective lever you can pull.
The Maths of Checkout Friction
Assuming a monthly ad spend of £2,000 driving 2,000 clicks, with 20% of visitors (400) adding a product to their cart:
By reducing friction and increasing cart conversion from 10% to 25%, your effective Cost Per Sale drops by 60% without spending a single extra penny on ads.
Does your checkout look trustworthy enough for a £50 order?
You’ve fixed the shipping surprises and smoothed out the forms. There's one last hurdle, and it's all about trust. The customer is on the final page, about to type in their credit card details. This is the moment of maximum risk for them. They're handing over sensitive financial information to a brand they may have only discovered ten minutes ago from an ad on Instagram.
Does your page look safe? Does it feel professional? This is not the place for a quirky design or off-brand colours. The checkout page should be clean, clear, and reassuring. It needs to have all the visual cues of a secure transaction that people are used to seeing on major retail sites.
First, the basics. You must have an SSL certificate (the little padlock icon in the browser bar). This is non-negotiable. But that’s just table stakes. You need to visually reinforce that security. Prominently display the logos of the payment methods you accept – Visa, Mastercard, Amex, Apple Pay. These aren't just payment options; they are trust signals. They are familiar symbols that tell the customer's brain, "This is a legitimate operation."
Social proof is also massively important here. Can you include a short customer testimonial on the checkout page? Or a star rating? Something to remind them that other real people have bought from you and had a good experience. A simple line like "Join 10,000+ happy homes using our products" can be surprisingly effective.
Finally, your policies need to be crystal clear and easy to find. What's your return policy? Is there a satisfaction guarantee? Having links to these in the footer of the checkout page provides a safety net. It tells the customer that if something goes wrong, you've got their back. It removes the final piece of perceived risk.
This isn't about tricking people. It's about recognising the inherent vulnerability a customer feels when buying from a new brand online and doing everything you can to make them feel secure. A quick blueprint for auditing the trust signals in your own checkout is detailed below.
Checkout Trust Audit & Action Blueprint
A prioritised matrix for identifying and fixing trust deficits that cause customers to abandon their purchase at the final step.
| Audit Area | Common Failure Point | Diagnostic Action Item | Expected Impact |
|---|---|---|---|
| 1. Security Signals | No visible payment logos; generic Shopify theme | Add a "Secure Payments" block with Visa, Mastercard, PayPal, etc. logos. Ensure SSL padlock is present. | Reduces Payment Hesitation |
| 2. Brand Professionalism | Checkout page design doesn't match the main site | Customise the checkout page (Shopify Plus) to use your brand's logo, colours, and fonts consistently. | Maintains Brand Continuity |
| 3. Social Proof | Checkout feels isolated and transactional | Embed a small, rotating customer testimonial or a simple "5-star average rating" badge near the payment button. | Builds Last-Minute Confidence |
| 4. Policy & Guarantees | Return/refund policy is hidden or unclear | Add clear, one-line links in the checkout footer: "30-Day Money-Back Guarantee", "Free Returns". | Removes Perceived Risk |
How can you model your own turnaround?
We’ve looked at the main culprits: surprise shipping costs, unnecessary friction, and a lack of trust signals. As we've seen, none of these are huge, complicated problems to fix. But their cumulative effect on your bottom line is massive. A 40% drop-off at shipping and a 35% drop-off at payment doesn't add up to a 75% loss; it compounds. You lose 40% of the initial group, and then 35% of the remaining group. The leaks drain your revenue potential exponentially.
To really see the power of fixing these issues, I've built one final simulator. It models a basic eCommerce funnel, starting from your ad clicks. You can set your ad costs and average order value. The Baseline scenario is a typical, unoptimised checkout with all the leaks we’ve discussed. Then, you can toggle the Action Levers—implementing free shipping, adding express checkout, and adding trust seals—to see the direct impact on your conversion rate, sales, and most importantly, your return on ad spend (ROAS).
Play around with it. See how fixing these seemingly small backend issues can generate the kind of growth—like that 190% revenue lift I mentioned earlier—that you can't achieve by just pouring more money into ads. This is how you build a truly efficient conversion system.
Checkout Revenue Leak Simulator
Toggle the fixes for the most common checkout leaks to see the projected impact on your monthly revenue and ROAS.
The factors that contribute to cart abandonment for premium products aren't a mystery. It's a solvable engineering problem. It’s about having the discipline to swap from staring at a single, useless metric to dissecting the system your customers have to navigate. It's rarely one big thing. It's a combination of small points of friction, moments of doubt, and unexpected costs that collectively break the premium experience you've promised.
Fixing it requires a systematic approach: map the journey, measure the drop-off at each step, identify the biggest leak, and plug it. Then find the next biggest leak and do it again. The frameworks and tools here give you a starting point for that diagnosis. It’s not glamorous work, but it’s where the real, sustainable growth in eCommerce comes from.
If you're staring at your own analytics, seeing the traffic come in but not converting, and you're not sure which leak to plug first, it might be time for an expert diagnosis. We offer a free initial consultation to do just that—get a second pair of expert eyes on your data and build a clear plan of attack.
Cite this Research & Data
If referencing this research, data, or strategy in your publication, please use the attribution below.

Lukas Holschuh
Founder, Growth & Advertising Consultant
Great campaigns fail without expertise. Lukas and his team provide the missing strategy, optimizing your entire advertising funnel—from ad creatives and copy to landing page design.
Backed by a proven track record across SaaS, eLearning, and eCommerce, they don't just run ads; they engineer systems that convert. A data-driven partnership focused on tangible revenue growth.