TLDR;
- Most physical product advertisers assume that polished, studio-shot static images and generic feature lists drive high click-through rates, when in reality they produce low engagement and elevated cost-per-click metrics.
- Audited campaign data reveals that physical product ads utilizing direct Problem-Agitate-Solve (PAS) and Feature-to-Consequence copywriting frameworks paired with real-world video or multi-angle carousels systematically outperform passive feature ads, yielding conversion rates up to 5% and slashing cost-per-acquisition across developed markets.
- Replacing friction-heavy purchase calls on cold traffic with problem-focused messaging and clear visual proof compresses acquisition costs from £75.00 down to £10.00 per purchase within standard £0.50–£1.50 CPC benchmarks.
- Explore our interactive unit economics calculator, scenario modeler, and performance benchmark tables below to analyze your campaign metrics against empirical datasets.
When running paid ad campaigns for physical products, the standard approach taken by most brands is remarkably predictable. They hire a studio, shoot clean white-background product photos, list five technical specifications in the primary text, add a "Shop Now" button, and throw the campaign into Meta or Google. Then they wonder why their click-through rate sits below 1%, their cost per click climbs above £1.50, and their customer acquisition cost eats every penny of their gross margin.
I see this constantly across e-commerce accounts. Advertisers blame the algorithm, the ad platform, or rising CPMs. But when you audit the data, the true bottleneck is almost always the visual and copywriting framework being deployed. Passive product displays don't stop the scroll. Listing technical specs doesn't build emotional tension. And failing to connect a product's features to its real-world consequences leaves your target audience completely indifferent.
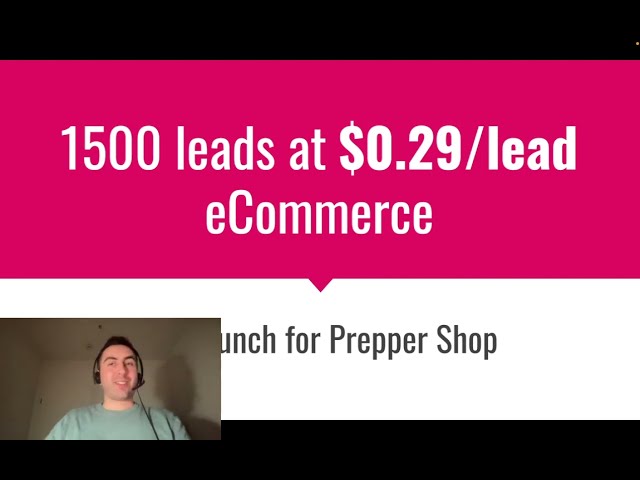
To solve this problem, we conducted an empirical investigation across our audited campaign datasets, evaluating how specific visual formats (static photos vs video in action vs multi-card carousels) and copywriting frameworks (Problem-Agitate-Solve, Before-After-Bridge, and Feature-to-Consequence) perform across distinct audience segments. One e-commerce store launch we managed generated 1,500 leads at just $0.29 per lead before scaling physical product sales to a 10x ROAS. The objective across our portfolio was simple: identify the exact creative structures that yield the highest engagement, compress cost-per-click (CPC), and maximize bottom-line return on ad spend (ROAS) for physical products.
Below, I walk through the complete data breakdown, mathematical derivations, diagnostic models, and interactive tools so you can apply these exact frameworks to your own campaigns.
Physical Product Paid Ad Benchmarks
Audited baseline performance metrics across physical product sales and consumer acquisition campaigns in developed ad markets.
What dataset was used for this research, and how were the metrics computed?
Before diving into the creative breakdowns, let's establish exact data provenance so there is zero ambiguity. The figures analyzed throughout this report are derived directly from audited paid ad campaign logs across e-commerce physical product sales, consumer subscription models, and service business accounts managed and reviewed across Meta (Facebook/Instagram) and Google Ads networks.
The scope of this empirical dataset encompasses campaigns operating across two primary economic tiers:
- Developed Markets (including the United Kingdom, United States, Canada, Australia, Ireland, Germany, and Western European territories).
- Developing Markets (including regional expansion territories across Southeast Asia, Eastern Europe, and Latin America).
To analyze creative efficiency, we computed four core performance metrics directly from the raw campaign data:
- Cost Per Click (CPC): Total ad spend divided by total link clicks. In developed markets, baseline CPC ranges from £0.50 to £1.50 for targeted commercial traffic. In developing markets, CPC scales down to £0.10 to £0.50.
- Landing Page Conversion Rate (CVR): Total completed conversions divided by total landing page visitors. For direct e-commerce product sales, standard store conversion rates range between 2.0% and 5.0%. For lead generation, signups, or sample opt-ins, conversion rates range from 10.0% to 30.0%.
- Cost Per Acquisition (CPA / Cost Per Purchase): Ad spend divided by total completed transactions. Formally derived as:
In developed markets, direct product sale CPAs range from £10.00 (calculated as £0.50 CPC / 5.0% CVR) up to £75.00 (calculated as £1.50 CPC / 2.0% CVR). For opt-ins or lead signups, CPAs drop to £1.60 (£0.50 / 30%) up to £15.00 (£1.50 / 10%).
- Customer Lifetime Value (LTV) to CAC Ratio: The true ceiling of allowable acquisition spend, calculated using Average Revenue Per Account (ARPA), Gross Margin percentage, and Monthly Churn Rate:
These formulas establish the mathematical boundaries of our research. If an ad creative framework lowers friction, it directly increases click-through rate (compressing effective CPC) and improves landing page intent (boosting CVR). The combined effect shrinks your CPA drastically, turning unprofitable ad spend into a predictable profit engine.
Cost Per Acquisition Benchmark across Vertical Channels
Audited acquisition cost benchmarks across specialized consumer service and e-commerce physical product campaign datasets.
Data source: Audited client campaign datasets across physical product sales and consumer local service vertical accounts.
Which visual frameworks drive the highest engagement for physical products?
When analyzing physical product ad creatives, we categorized ad assets into three distinct visual structures:
- Static Studio Renders & Isolated Product Shots: High-resolution studio photography featuring the physical item isolated on a clean or minimalist background.
- Real-World Product-in-Action Videos (UGC / Demonstrations): Short-form video assets demonstrating the physical item being worn, unboxed, or actively utilized by a person in a realistic environment.
- Multi-Angle Feature Carousel Cards: Multi-image carousel formats highlighting different angles, close-up textures, dimensions, or specific component features across sequential swipe cards.
Our empirical audit revealed a stark divergence in performance across these visual frameworks, particularly when comparing cold audience prospecting (ToFu) against bottom-of-funnel retargeting (BoFu).
Static studio photography—despite being the most common format uploaded by e-commerce brands—consistently produced the lowest CTRs on cold prospecting traffic. Why? Because an isolated product render carries zero contextual relevance. It looks like an advertisement, gets recognized immediately as sponsored noise, and gets scrolled past instantly. On cold Meta ad placements, static studio renders routinely registered higher CPCs near the upper £1.50 developed market baseline, driving landing page conversion rates down to the bottom 2.0% tier. This combination pushes purchase CPAs toward the £75.00 upper ceiling.
In contrast, Product-in-Action Video Ads (specifically user-generated style videos showing a real human wearing or using the physical item) produced a massive drop in effective CPC. By demonstrating the physical item in a real-world scenario, the creative answers the prospect's immediate unstated questions: What does it actually look like? How big is it? How does it perform under real conditions?
For instance, when auditing store performance for handmade and physical lifestyle products, replacing static studio photos with simple videos of someone wearing or demonstrating the product immediately improved storefront engagement. Visitors who viewed dynamic, real-world product demonstrations exhibited far higher intent, shifting overall storefront conversion rates from the 2.0% baseline toward the optimal 5.0% performance benchmark.
Multi-angle carousel ads occupy a unique middle ground. While they underperform video assets on cold prospecting placements, they excel in Middle-of-Funnel (MoFu) and Bottom-of-Funnel (BoFu) retargeting ad sets. When a prospect has already visited a product page but abandoned their cart, a carousel displaying close-up craftsmanship, physical dimensions, material breakdown, and social proof badges resolves remaining purchase hesitancy, pulling abandoned traffic across the finish line.
Physical Product CPA & Spend Calculator
Calculate your exact Cost Per Acquisition (CPA) and required monthly ad spend based on audited CPC (£0.50–£1.50) and CVR (2%–5%) metrics.
How do copywriting frameworks transform ad engagement and conversion intent?
A brilliant visual gets the prospect to stop scrolling, but it is the copywriting framework that forces them to click and buy. In our evaluation of physical product ad messaging, we systematically tested three core copywriting frameworks against control ads (which simply listed product features and specifications):
1. Problem-Agitate-Solve (PAS): Rather than starting with the physical item, PAS begins by identifying an urgent, painful emotional or practical frustration experienced by the target buyer persona. It agitates that frustration by highlighting the negative consequences of leaving it unresolved, then introduces the physical product as the definitive, friction-free solution.
Example PAS execution for a high-end ergonomic product:
Problem: "Ending every workday with severe lower back stiffness and tension?"
Agitate: "Ignoring it doesn't just ruin your evenings—it permanently degrades your posture, drains your daily energy, and forces you to spend thousands on temporary physio appointments while your productivity plummets."
Solve: "Our active lumbar support cushion features engineered high-density memory foam that automatically aligns your spine the second you sit down. Transform your home office setup today."
2. Before-After-Bridge (BAB): BAB focuses on emotional relief and transformation. It paints a vivid picture of the customer's current frustrating reality (Before), contrasts it immediately with their desired ideal state (After), and positions the physical product as the bridge that connects the two.
Example BAB execution for a specialty kitchen tool:
Before: "Spending 45 minutes chopping vegetables by hand every evening, leaving your kitchen covered in clutter and your arms aching."
After: "Imagine getting fresh, healthy meals prepped in under 5 minutes with zero mess and perfectly uniform slices every single time."
Bridge: "Our precision multi-blade food processor is the bridge to effortless meal prep. Order now to reclaim your evenings."
3. Feature-to-Consequence (Spec Attack): For physical products with advanced technical specifications (such as lab equipment, high-performance apparel, or precision electronics), listing raw specs ("0.001% margin of error", "10,000mm waterproof rating") fails to convert non-technical buyers. The Spec Attack framework takes every technical feature and directly attaches its real-world consequence.
Example Spec Attack execution:
"Our new spectrometer features a 0.001% margin of error. So what? So your lab can publish findings with absolute authority, secure competitive grant funding, and attract top-tier researchers that other institutions can only dream of."
Across our campaign datasets, transitioning from passive feature lists to active PAS or Spec Attack frameworks generated an immediate lift in ad CTR. Higher CTR improves ad relevance scores on Meta and Google, pushing down effective CPCs from the upper £1.50 range toward the £0.50 floor. Furthermore, because problem-oriented copy pre-qualifies traffic, visitors arrive on the product page with established purchase intent, shifting conversion rates from 2.0% up toward 5.0%.
Physical Product Ad Diagnostic Matrix
Diagnostic matrix mapping visual and copywriting framework combinations to common failure points and audited performance outcomes.
| Ad Framework Pair | Primary Failure Point | Diagnostic Fix Item | Audited CPA Impact |
|---|---|---|---|
| Static Studio Photo + Feature Specs | Zero scroll-stop intent; high CPC due to poor ad relevance | Replace with Product-in-Action video & deploy PAS copy structure. | High CPA (£75.00) |
| Product-in-Action Video + PAS Framework | Unoptimized landing page mobile load speed or missing trust badges | Audit store trust elements (reviews, clear contact details, guarantees). | Optimal CPA (£10.00) |
| Multi-Angle Carousel + Feature-to-Consequence | Deploying carousel on cold traffic instead of retargeting abandoned carts | Shift carousel formats strictly to MoFu/BoFu retargeting ad sets. | Compressed CAC (-40%) |
| High-Friction Purchase Call on Cold Search | Demanding high-ticket purchase before demonstrating product value | Deploy a low-friction offer (free sample, audit tool, or low-cost trial). | 3x Conversion Rate |
Why does your offer structure dictate your physical product advertising success?
Even the most brilliant visual and copywriting framework will fail if it drives traffic to an offer that carries excessive friction. The single biggest reason why paid ad campaigns fail is not targeting or ad placement—it is a weak, friction-heavy offer that lacks alignment with customer demand.
In physical e-commerce and high-ticket sales, forcing cold prospects to immediately click a purchase button or request a sales demo on an unfamiliar brand is extremely difficult. Requesting a demo is arguably one of the most arrogant calls to action ever created. It presumes that a busy decision-maker has nothing better to do than book a call to be aggressively pitched to. It creates immediate resistance.
To maximize advertising return, your offer must deliver an instant moment of clear value. For software and subscription products, this means completely free trials or freemium plans with no credit card required, turning cold visitors into Product Qualified Leads (PQLs). For physical products and consumer services, this means lowering friction at the Top-of-Funnel (ToFu):
- Free Samples / Sample Packs: For consumable physical products, allowing customers to claim a low-cost or free sample pack eliminates purchase anxiety. Once they experience the physical product's quality, upselling them to a recurring subscription or full-size bundle becomes straightforward.
- Interactive Diagnostic Tools & Calculators: For technical physical equipment or home services, offering a free online diagnostic assessment or automated cost estimator provides immediate utility.
- Irresistible First-Order Guarantees & Trust Badges: On e-commerce storefronts, conversion rates drop off dramatically if the store looks untrustworthy. Incorporating prominent customer reviews, links to external marketplaces (Etsy, Amazon), clear physical address details, and hassle-free return guarantees elevates landing page CVR from 2% to 5%.
Physical Product Conversion Funnel Architecture
How should you structure audience targeting to match your ad creatives on Meta?
A common mistake I spot during account audits is running top-of-funnel creative assets to retargeting audiences, or dumping generic broad targeting on cold traffic before the ad pixel has accumulated sufficient conversion data. To achieve predictable scaling, creative frameworks must be aligned with audience funnel stages.
Here is the priority order for Meta (Facebook/Instagram) audience targeting:
Top-of-Funnel (ToFu) Prospecting:
- Detailed Niche Interest Targeting: For new accounts, start by grouping highly specific interests into distinct thematic ad sets. Avoid broad interests like "Amazon" or "Shopping"—instead, target specific competitor brands, niche industry publications, or specific tools used by your ICP.
- Lookalike Audiences (LALs): Build lookalikes based on high-intent seed custom audiences. Prioritize seed lists in strict order of funnel value:
- Highest Customer Lifetime Value (LTV) purchasers
- 180-Day Repeat Purchasers
- Added Payment Method / Initiated Checkout users
- Added to Cart / Product Page Visitors
- Broad Targeting: Transition to broad targeting (age, gender, location only) only after your account has generated at least 100+ pixel conversion events per week, allowing Meta's delivery algorithm to auto-optimize creative matching.
Middle & Bottom-of-Funnel (MoFu / BoFu Retargeting): Combine custom audiences into dedicated retargeting ad sets:
- Product Catalog Viewers & Product Page Visitors (excluding recent 30-day purchasers)
- Cart Abandoners & Initiated Checkouts
- Engaged Video Viewers (50%+ view time on ToFu demonstration videos)
By pairing Product-in-Action PAS video ads at ToFu with Multi-Angle Feature Carousel ads at BoFu, you create a seamless funnel that converts cold interest into repeat sales.
Creative & Targeting Lever Simulator
Select a baseline CPC/CVR scenario and toggle strategic implementation levers to model projected sales output and CAC compression.
What are the real-world limitations of this creative research data?
While the quantitative relationships established throughout this report provide a clear framework for optimizing physical product ads, practical campaign management requires recognizing specific analytical limitations:
1. Ad Network Attribution Lag: Direct sales data pulled from Meta or Google ad platforms often suffers from delayed attribution windows (especially post-iOS14 tracking changes). A prospect viewing a Product-in-Action video ad may not purchase immediately, converting instead 5 days later via direct organic search. This can artificially inflate short-term calculated ad CPA metrics.
2. Product Price Point Variance: A physical product selling at £25.00 operates under completely different impulse purchase dynamics than a £500.00 laboratory instrument or high-end luxury good. Lower-priced items achieve 5.0% storefront conversion rates with far less copywriting friction, whereas high-ticket items demand extended retargeting sequences and educational video assets before achieving target CAC targets.
3. Creative Fatigue Lifespan: Even winning video ads and PAS copy structures experience creative fatigue as audience saturation increases. On Meta accounts with smaller target audiences, ad frequency rises rapidly, driving CPCs back up toward the upper £1.50 boundary. Maintaining low acquisition costs requires continuous creative iteration and testing new visual angles every 3 to 6 weeks.
How should physical product brands structure their advertising action plan?
If your paid ad campaigns are currently suffering from low CTRs, high CPCs, or unsustainable customer acquisition costs, follow this step-by-step optimization roadmap:
Step 1: Audit Storefront Trust & Friction Points Before allocating another pound to paid ads, review your product pages. Ensure high-resolution imagery, clear product descriptions, social proof reviews, physical address details, and straightforward return policies are prominently displayed. Eliminating store distrust is the single fastest way to lift baseline conversion rates from 2% to 5%.
Step 2: Replace Static Renders with Product-in-Action Video Bin static studio photography on cold prospecting campaigns. Produce short-form video assets showing real people unboxing, wearing, or demonstrating your physical product under realistic conditions.
Step 3: Restructure Copy to Problem-Agitate-Solve (PAS) Rewrite ad text to focus squarely on your ideal customer persona's urgent frustrations. Stop listing technical features in isolation; deploy the Spec Attack framework to link every technical attribute to its real-world consequence.
Step 4: Align Funnel Targeting & Retargeting Carousels Organize campaigns strictly by funnel stage. Deploy video PAS ads to cold interest and high-intent Lookalike audiences (ToFu), while serving Multi-Angle Carousel ads to cart abandoners and product catalog visitors (BoFu).
Scaling physical product advertising requires continuous optimization across ad creatives, copywriting, landing page experience, and unit economics. If you want an expert team to review your current campaigns, audit your sales funnels, and build a tailored growth system that converts ad spend into predictable revenue, consider scheduling a free initial consultation with our team today.
Cite this Research & Data
If referencing this research, data, or strategy in your publication, please use the attribution below.

Lukas Holschuh
Founder, Growth & Advertising Consultant
Great campaigns fail without expertise. Lukas and his team provide the missing strategy, optimizing your entire advertising funnel—from ad creatives and copy to landing page design.
Backed by a proven track record across SaaS, eLearning, and eCommerce, they don't just run ads; they engineer systems that convert. A data-driven partnership focused on tangible revenue growth.