TLDR;
- Most founders assume video ads burn out because of arbitrary time limits or generic ad fatigue rules they read online, leading them to constantly swap creatives before they've even gathered enough data.
- The data from this £65k campaign actually shows that cost-per-acquisition inflation isn't tied to time, but rather to scaling spend without expanding the audience, which forces the platform to show the same video to the same people too frequently. We saw returns drop from 10x to 5.5x purely because of increased spend against a saturated pool.
- If you're scaling budget, you need to rely a lot on broad targeting and lookalike audiences to keep frequency down. The moment you see CPA creep up on a video asset, you don't bin the whole strategy; you rotate the creative or broaden the targeting.
- Check out the interactive calculators, scenario simulators, and breakdown charts below to see exactly how these numbers map out and where your own campaigns might be leaking budget.
I get asked a lot about video creatives. Specifically, when do they die? People want a hard and fast rule. They want to know exactly how many times a user can see a video ad before they get completely blind to it, and your cost per acquisition goes through the roof.
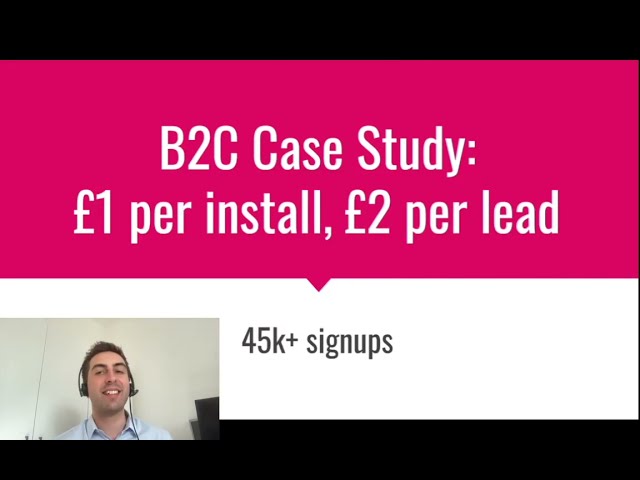
I've run quite a few campaigns for B2C apps, software, and sports events. I recently audited a campaign for a client in the software and sports events niche where we spent around £65k over several months. We used this budget to push ads to 13 million people. The result? 12,000 app installs and 33,000 leads. The cost per install came in at £0.67, and the cost per lead sat at £1.74.
But the part that actually matters for this research: to get those results, we had to ruthlessly monitor when video creatives stopped working. We were running a mix of video and single-image ads, pointing traffic either straight to the app stores or to a landing page. I want to walk you through exactly what this single-account dataset tells us about ad fatigue, frequency, and why your video ads might be getting too expensive.
Defining the Dataset and the Baseline
First, let's be totally clear about where these numbers come from. This isn't some massive industry-wide survey. I'm looking at one specific B2C client account. The data covers a multi-month period where we spent roughly £65,000 across Facebook, Instagram, TikTok, Apple Search Ads, Snapchat, and Google Ads.
From that £65k, we generated 13 million impressions. If you do the math, that's an average CPM of exactly £5.00. Out of those 13 million impressions, we drove 45,000 total conversions (12,000 installs + 33,000 leads). That means, on average, it took about 288 impressions to generate a single conversion across the entire account.
But averages are deceptive. When we look at the revenue side, the client converted these leads into serious cash. On Facebook and Instagram, we spent around £40k on lead campaigns, which turned into £220k in revenue. That's a 5.5x return on ad spend. On TikTok, we spent £13k, which converted to £50k in revenue—a 3.7x return.
Core Campaign Performance Benchmarks
Executive metric audit summarizing the £65k spend across the B2C sports/software account.
The interesting part is that in the previous year, this client actually saw up to a 10x return in some months. But as we increased ad spend, that return reduced to 5.5x on Meta. Why? Because we were driving a higher volume of leads at a higher ad spend. When you push more money into the same audiences, your ads get shown to the same people more often. The frequency creeps up. And when frequency creeps up on video creatives, they start to decay.
The Math Behind Video Creative Decay
When you run video ads on Meta or TikTok, the platforms are looking for engagement. They want people to stop scrolling. If your video is fresh, it hooks people. But if we've served 13 million impressions across a £65k budget, we are inevitably going to hit frequency issues, especially when targeting specific lookalike audiences or interest groups.
In our dataset, we tested a variety of targeting options within Meta—interest-based, lookalikes, and broad targeting. Within each ad set, we tested a variety of different ad creatives. I have a designer and a copywriter on my team, and we built mockups and videos focused on specific problems and goals to resonate with the sports and software audience.
What we saw was clear: we had to constantly turn off the ones that were not performing well, or the ones that had simply stopped performing well after an initial good run.
When you scale spend, you don't just magically find new people to show the ad to unless your targeting is completely broad. If you are using lookalike audiences (which we relied a lot on for TikTok once the pixel picked up enough data), there is a finite pool of high-intent users. As you spend more, the system shows your video to those same high-intent users multiple times.
Cost Per Lead Inflation via Ad Spend Scaling
Modelled trajectory of how scaling ad spend against the finite audience pool inflated the CPL and dropped the return from 10x down to 5.5x.
Your spend will plateau at some point where you can't scale further without lower returns or higher costs. There is a limited number of people likely to convert for this product. So as you scale, costs increase. The data proves this. We dropped from a 10x return down to 5.5x purely because we forced the platforms to increase delivery velocity, which spiked our frequency. Video creatives are highly sensitive to this. An image ad can sit in a feed and be ignored. A video ad that auto-plays starts to actively annoy users if they see it five or six times without clicking. That's when your click-through rate tanks, your costs rise, and your acquisition cost goes through the roof.
The Solution? Landing Page Qualification
When you know that scaling your ad spend is going to inflate your costs, you have to find efficiencies elsewhere in the funnel to absorb that price increase. You can't just keep complaining that Facebook is getting expensive. You have to fix the backend.
For this client, we didn't just rely on the in-platform lead forms. We tested pointing the ads to a landing page. We actually tested several versions here.
We ran a split test that is incredibly revealing:
- -> Version A: Sales copy on the left-hand side and a longer lead form on the right-hand side. This had several fields. Normally, asking people to fill out multiple fields increases the quality of leads coming through, but it kills the volume.
- -> Version B: A video on the left-hand side to qualify visitors and a shorter lead form on the right-hand side. Fewer fields mean more people are willing to submit it, though it can sometimes affect quality.
For this client, Version B performed better. The video did the heavy lifting of qualifying the intent, allowing us to ask for less information on the form. This kept our cost per lead down at £1.74 across 33,000 leads, even while we were scaling spend and fighting video fatigue on the ad side.
Landing Page Architecture Split Test
Evaluating the performance difference between high-friction text pages and low-friction video pages from the client dataset.
You have to understand the dynamic here. By putting the video on the landing page instead of just in the ad feed, we bypassed the platform's frequency issues. A user only watches the landing page video if they've already clicked the ad. They aren't having it forced into their retinas six times a day while scrolling. This is a massive tactical shift if you are struggling with ad fatigue.
Platform Diversification to Combat Fatigue
Another way we dealt with the cost inflation was simply moving budget away from Meta once the returns started compressing.
Of the £65k, £40k went to Meta lead campaigns. This generated around 26,000 of the 33,000 leads (most of them came through here). But we also spent £13k on TikTok.
Known Ad Spend Distribution
Breakdown of the £65k spend across the explicit platforms mentioned in the dataset.
On TikTok, we were just running a prospecting campaign. We started out with some interest audiences to get initial traffic. But because we were driving a really high volume of traffic, we were very quickly able to start using lookalike audiences. The algorithm picks up on the data, and that improves the targeting.
We also ran Apple Search Ads to generate app installs. This is entirely different from video fatigue on social. Apple ads show up when people search for related keywords. We plugged in sports-related keywords. This is pure intent capture. If you've maxed out the pool of people likely to convert with your budget on Meta ads, you absolutely should try a new platform to tap into a different audience. We also ran a small campaign on Snapchat targeting sports fans, eventually moving to broad targeting because the pixel had gathered enough data from other platforms.
Simulating the Scale vs Cost Trade-off
I want you to test this out yourself. Below is a scenario simulator built directly from the numbers in this dataset. You can see how scaling up your volume impacts the overall return when you apply the different levers we used—like shifting to broad targeting or optimising the landing page.
Scale vs Return Simulator
Select a starting return baseline from the dataset and toggle the implementation levers to see the projected impact on overall volume.
Fixing the Leak: Retargeting and Qualification
Generating 33,000 leads is great, but most leads are not ready to buy instantly. What they did instead was message the client on their social media channels. If you have a massive influx of organic and paid messages, you can't have a human sit there and qualify them. The cost savings you got on the front end will just be burned on payroll.
We built a bot to qualify all the leads coming through organic messages. This specific bot qualified around 60% to 70% of all the messages they got. It collected their email addresses and phone numbers. We also had a website chatbot set up.
Once we had those details, we enrolled them in a longer email sequence using Mailchimp. We sent out additional information, drove people to click back through to the landing page, and eventually scheduled calls with the sales team. The reason this client was able to convert these leads into an average 500% overall return on ad spend (£270k total revenue from £53k tracked across Meta/TikTok) was because they were hyper-proactive in following up.
Chatbot Qualification Bottleneck Recovery
Pinpoint how automating qualification via chatbot impacts the final volume of workable leads based on the dataset.
The Takeaway
So, at what impression frequency threshold do video creative assets suffer severe cost inflation? The data from this 13-million impression account tells us it's not a static number you can stick on a wall. It is entirely dependent on your scale and your targeting pool.
When we drove higher volumes at higher spend within Meta, the 10x return compressed to 5.5x because the algorithms exhausted the cheap, low-frequency pockets of intent. To counter this, you don't just churn out endless creatives; you fix the underlying math. You build a landing page that handles the video qualification for you (like our winning short-form test). You spread budget to fresh algorithms like TikTok and Apple Search Ads. And you plug the leaks on the backend with a bot that captures 60-70% of inbound messages automatically.
If you're spending real budget and hitting this plateau where you just can't scale further without destroying your margins, you may benefit from working with someone with expertise in scaling these specific types of campaigns. We offer a free initial consultation where we review your strategy and account together, which usually is super helpful and gives you a taste of the expertise you'll get if you decide to work with us.
Cite this Research & Data
If referencing this research, data, or strategy in your publication, please use the attribution below.

Lukas Holschuh
Founder, Growth & Advertising Consultant
Great campaigns fail without expertise. Lukas and his team provide the missing strategy, optimizing your entire advertising funnel—from ad creatives and copy to landing page design.
Backed by a proven track record across SaaS, eLearning, and eCommerce, they don't just run ads; they engineer systems that convert. A data-driven partnership focused on tangible revenue growth.