Main Takeaway
- Most people assume high-intent traffic like searches for specific solutions always converts better and costs less.
- The data from this £3.4k Google Ads account shows the opposite can be true: broader, top-of-funnel traffic sometimes had a higher conversion rate and a lower cost-per-acquisition than more specific, high-intent search traffic.
- The main takeaway is that landing page alignment is more important than raw intent. A generic landing page can waste expensive, high-intent clicks because it doesn't meet the user's specific expectations.
- Below, I have built several interactive tools, including a scenario simulator and a searchable keyword database, to break down the real financial impact of this intent mismatch.
Everyone in paid advertising bangs on about user intent. The story goes that if you can just capture someone at the bottom of the funnel, when they're actively looking for your exact solution, the conversion is practically a done deal. You'll get higher conversion rates, lower costs, and your return on ad spend will shoot through the roof. It sounds good. It's logical. But how often does anyone actually put hard numbers to it?
It's one of those bits of common wisdom that gets repeated so often, nobody questions it. But I've run quite a few campaigns for software products and seen enough accounts go sideways to be a bit cynical about easy answers. So I decided to dig into a recent account to answer a simple question: What is the real, quantifiable impact of audience intent on landing page conversion performance? Are we talking a 10% uplift, or a 10x multiplier? And what happens when the numbers don't follow the script?
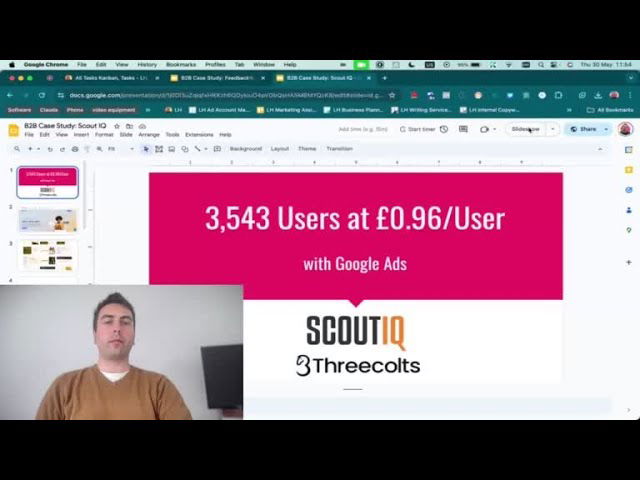
To investigate this, I'm using a complete Google Ads dataset from a single account for a SaaS product called ScoutIQ, an app for online booksellers. The account spent a total of £3,387.34 to acquire 3,543 new users through a mix of app installs and website registrations. What makes this dataset particularly useful for our question is the structure of its search campaign. It was neatly segmented into ad groups targeting different levels of user intent: broad Top-of-Funnel (TOFU), solution-aware Middle-of-Funnel (MOFU), and competitor/brand-focused Bottom-of-Funnel (BOFU). This gives us a clean way to isolate traffic by intent and see how it actually behaved once it hit the landing page.
A quick health warning before we crack on: this is an analysis of one account. The findings are specific to this campaign, this product, and its audience. They are not universal benchmarks. However, the principles they reveal about the relationship between what a user searches for and how they behave on your site are, in my experience, widely applicable. Let's get into the data.
Does higher intent actually mean higher conversion rates?
The logical place to start is with the main search campaign. This is where we can most clearly see the different intent levels at play, separated by ad group. I've defined the intent levels for this analysis based on the ad group targeting:
- Low Intent (TOFU): Broad match keywords like "selling online". The user has a problem but isn't necessarily aware of a specific solution like a book scanner app.
- Medium Intent (MOFU): Phrase match keywords like "book scanner app". The user is solution-aware and actively looking for a tool that does what ScoutIQ does.
- High Intent (BOFU): Phrase match keywords targeting competitors and the brand name itself. The user is in the final decision-making stage.
According to the textbook, we should see a clear staircase pattern: conversion rates should climb steadily as we move from TOFU to MOFU to BOFU. So, let's look at the numbers. The table below summarises the performance of the main ad groups within the main LH Search campaign. A quick note on data integrity: the source report for the 'LH BOFU Brand keywords' ad group listed a 0.00% conversion rate despite showing 24 conversions from 83 clicks. This is an obvious reporting glitch. For this analysis, I've manually calculated the correct conversion rate (28.9%) to give us a proper picture.
When we plot these conversion rates, the textbook theory starts to fall apart a bit.
Search Conversion Rate by User Intent
Website conversion rate (Conversions / Clicks) for the four main ad groups within the LH Search campaign, segmented by estimated user intent.
LH Search Ad Groups).
Time Period: Jun 2020 – Mar 2024
The results are messy. As expected, branded search traffic is the clear winner with a 28.9% conversion rate. These are people who already know ScoutIQ and are looking for it by name, so their path to conversion is short. No surprises there.
But look at the rest. The broad, low-intent "Selling Online" traffic converted at 21.6%. The more specific, high-intent MOFU traffic, people searching for "book scanner app", converted at just 18.7%. And the competitor traffic, which should be red-hot, converted at a miserable 6.4%. That's not a staircase, it's a mess. The supposedly worse TOFU traffic is outperforming the better MOFU traffic by nearly 16% (21.6% vs 18.7%).
This is the first major crack in the high intent is always better theory. What it suggests is that the landing page was well-optimised for a general, problem-aware audience, but failed to meet the more specific expectations of users who were further down the funnel. Someone searching "sell books online" who lands on a page about a cool app for selling books online might be pleasantly surprised and sign up. But someone searching for "best book scanner app" or "Scoutly alternative" lands on that same generic page and thinks, "This doesn't answer my specific question". They expected a comparison, a feature list, or something that directly addresses their more advanced query. When they didn't get it, they bounced.
Is cheaper traffic actually more efficient in practice?
If the conversion rates are counter-intuitive, what about the cost? A lower conversion rate can be fine if the traffic is dirt cheap. The metric that ties this together is Cost Per Conversion (or Cost Per Acquisition). Here, we look at how much it cost to get one web registration from each of these intent-based ad groups.
You'd expect the higher-intent traffic to be more efficient, leading to a lower cost per conversion. But given what we've just seen with conversion rates, we should probably brace ourselves.
The Real Cost of Acquiring a User by Intent
A breakdown of the main efficiency metrics (CPC, CVR, Cost/Conv) for each search ad group shows how conversion rate, not just click cost, dictates final acquisition cost.
The lowest cost per conversion comes from brand traffic. However, the broad TOFU traffic was 8% cheaper per conversion than MOFU and 28% cheaper than competitor traffic, driven by a superior conversion rate despite similar CPCs.
Again, the results defy standard logic. The brand traffic was the most efficient at £1.75 per conversion, thanks to cheap clicks and the highest conversion rate. That's our baseline for perfectly aligned intent.
But the supposedly low-quality TOFU traffic delivered conversions for £2.55 each. The better MOFU traffic was more expensive, at £2.77 per conversion. And the BOFU competitor traffic was the least efficient of the three, at a hefty £3.55. The cost per click (CPC) was broadly similar across all non-brand groups, hovering between £0.57 and £0.66. The tiny differences in CPC had almost no bearing on the final cost per conversion. The entire difference in efficiency was driven by the conversion rate.
The campaign was actually getting a better return by spending money on broad, top-of-funnel users than it was on solution-aware users or those checking out the competition. This isn't an argument against targeting high-intent users. It's an argument that if you do target them, you absolutely must serve them a landing page experience that matches their sophisticated query. You can't show a user searching for "ASellerTool vs ScoutIQ" a generic homepage and expect them to convert. You're just paying a premium for a click that is destined to fail.
This demonstrates a massive, and common, wasted opportunity. This advertiser was paying more for better traffic, only to squander it on a misaligned landing page, resulting in a higher effective cost per acquisition. The cheap traffic was actually the more profitable workhorse of the campaign.
How can you model the financial impact of intent and alignment yourself?
Seeing the numbers in a table is one thing, but it's more powerful to see how these small differences in conversion rate and cost play out across a real budget. To make this tangible, I've built a small simulator based on the data from this account. You can select a baseline intent scenario, which pre-fills the tool with the actual CPC and Conversion Rate we observed in the campaign. Then, you can adjust your monthly ad spend and toggle on an alignment fix representing an improvement to the landing page that doubles the conversion rate for that specific traffic. See for yourself how a simple landing page tweak can be more powerful than just pouring more money into the top of the funnel.
Intent & Alignment Impact Simulator
Select a baseline intent scenario from the ScoutIQ campaign data, set your budget, and see the projected impact of improving landing page alignment.
Does this intent alignment apply across all ad channels?
This principle of alignment isn't confined to just Google Search. It's a universal law of paid media. To see it in action elsewhere, we only need to look at the other campaigns running in this account. The advertiser tested several campaign types: Performance Max (a hybrid), App Installs (very specific intent), and Discovery/Demand Gen campaigns for both top-of-funnel (TOFU) awareness and middle-of-funnel (MOFU) retargeting.
Let's compare the cost per conversion across these different strategies. This gives us a sense of how efficient each channel was at turning a click into a user, regardless of the different user journeys involved.
Cost Per User Acquisition Across All Campaign Types
A comparison of the final Cost Per Conversion (Install or Web Registration) across all major Google Ads campaigns run for the ScoutIQ account.
Data Source: Cumulative performance from the ScoutIQ Google Ads account (Jun 2020 – Feb 2024).
The differences are stark. The Demand Gen (Discovery) campaigns are wildly expensive, with TOFU traffic costing £17.97 per conversion and the MOFU retargeting traffic costing an even worse £23.45. This again flies in the face of the idea that retargeting (higher intent) is always more efficient. In a visual, passive environment like the Gmail or YouTube home feeds, interrupting someone is expensive, and it requires exceptional creative to drive a direct conversion.
At the other end of the spectrum is the App Install campaign, with a stunningly low cost of just £0.30 per install. This is the perfect example of total alignment. The user is in the Google Play Store. Their intent is to discover and install apps. The ad is an app listing. The landing page is the app store page itself. The call to action is the install button. Every single step of the journey is perfectly matched to the user's context and intent. There is zero friction, and the result is an incredibly efficient acquisition channel.
Performance Max and Search sit in the middle. They are both intent-driven channels that capture users who are actively looking for something, and they deliver reasonably efficient conversions at £1.20 and £2.60, respectively. They work because there is a fundamental alignment between what the user wants and what the ad offers. The inefficiency we saw within the Search campaign was a secondary problem of misalignment at the landing page level. The channel itself was sound.
What do the keyword-level performance numbers reveal?
To dig one level deeper, we can look at the performance of individual keywords within the search campaign. This is where the nuance of intent really comes to life. A user searching "sell used books" has a different mindset and expectation than someone searching "book value scanner app".
I've extracted the top-performing keywords from one of the source reports and categorised them by their likely intent (TOFU, MOFU, or BOFU). I also calculated the conversion rate for each, based on the clicks and conversions reported. There were some inconsistencies in the raw data, so I've prioritised the most plausible figures for this analysis. The table below is interactive – you can filter by intent level or search for specific terms to explore how performance changes with the user's language.
Search Keyword Performance Database
| Keyword | Intent | Clicks | Conversions | Conv. Rate |
|---|
Playing with the data reveals some interesting patterns. The top-performing keyword by volume, "sell books online," is classic TOFU. It drove a huge number of clicks and converted at a very healthy 22.6%, forming the backbone of the campaign's success. But then look at "app for book value" - a much more specific, MOFU query. It converted at an excellent 31.3%. This shows that when the keyword implies a very specific need that the landing page happens to address well (showcasing how the app determines book value), the conversion rate can be fantastic.
However, other MOFU terms like "book selling app" underperformed, converting at just 15.9%. This reinforces our core finding: intent is granular. The small difference in phrasing between "app for book value" and "book selling app" seems to create a different set of user expectations. The landing page managed to satisfy one, but not the other. Your job as a professional or media buyer is to spot these differences and build pathways that cater to them, rather than treating all high-intent traffic as a uniform bloc.
What is the final verdict on intent versus alignment?
So, what's the real impact of audience intent on landing page performance? The answer from this dataset is clear: intent, on its own, is a poor predictor of success. High intent is not a golden ticket. It's a high-stakes bet. You're often paying more per click for a user who has a much more specific, and therefore less forgiving, set of expectations.
The true driver of conversion performance is alignment. It's the degree of harmony between the user's context, their query, your ad's promise, and your landing page's delivery.
- When alignment is perfect, as in the App Install campaign, conversion rates are astronomical and costs are minimal.
- When alignment is good, as with the TOFU search traffic hitting a relevant landing page, performance is strong and efficient.
- When alignment is broken, as with the MOFU and competitor search traffic hitting a generic page, you get the worst of all worlds: expensive clicks that don't convert, leading to a disastrously high cost per acquisition.
For anyone working in conversion rate optimization, the lesson is to stop thinking about optimising the landing page. You need to be thinking about optimising specific user journeys. Map your high-value keywords and ad groups not just to a single page, but to a tailored experience. If someone is searching for a competitor, send them to a page that directly compares your product to that competitor. If they're searching for a specific feature, have a page that heroes that feature. You have to earn that high-intent conversion.
And for advertisers, your responsibility extends beyond the click. It's not enough to segment your campaigns by intent if you're funnelling all that carefully curated traffic into the same generic bucket. You need to work hand-in-glove with your web and product teams to ensure that the journey is seamless from start to finish. If you don't, as this data clearly shows, you're not just leaving money on the table – you're actively setting it on fire.
I've detailed my main recommendations for you below: Getting this level of strategic alignment right across multiple channels, audiences, and landing pages is complex. It requires a forensic look at the data, a deep understanding of customer psychology, and a rigorous testing process. If you're struggling to make your ad spend work as hard as it should, or if you're seeing some of the same counter-intuitive results in your own accounts, it might be time for an expert review. We offer a free, no-obligation strategy consultation where we can look at your data together and figure out where the real opportunities for growth are hiding.
Cite this Research & Data
If referencing this research, data, or strategy in your publication, please use the attribution below.

Lukas Holschuh
Founder, Growth & Advertising Consultant
Great campaigns fail without expertise. Lukas and his team provide the missing strategy, optimizing your entire advertising funnel—from ad creatives and copy to landing page design.
Backed by a proven track record across SaaS, eLearning, and eCommerce, they don't just run ads; they engineer systems that convert. A data-driven partnership focused on tangible revenue growth.